Thai vs Immigrants from Iraq Householder Income Under 25 years
COMPARE
Thai
Immigrants from Iraq
Householder Income Under 25 years
Householder Income Under 25 years Comparison
Thais
Immigrants from Iraq
$59,187
HOUSEHOLDER INCOME UNDER 25 YEARS
100.0/ 100
METRIC RATING
6th/ 347
METRIC RANK
$53,384
HOUSEHOLDER INCOME UNDER 25 YEARS
94.9/ 100
METRIC RATING
123rd/ 347
METRIC RANK
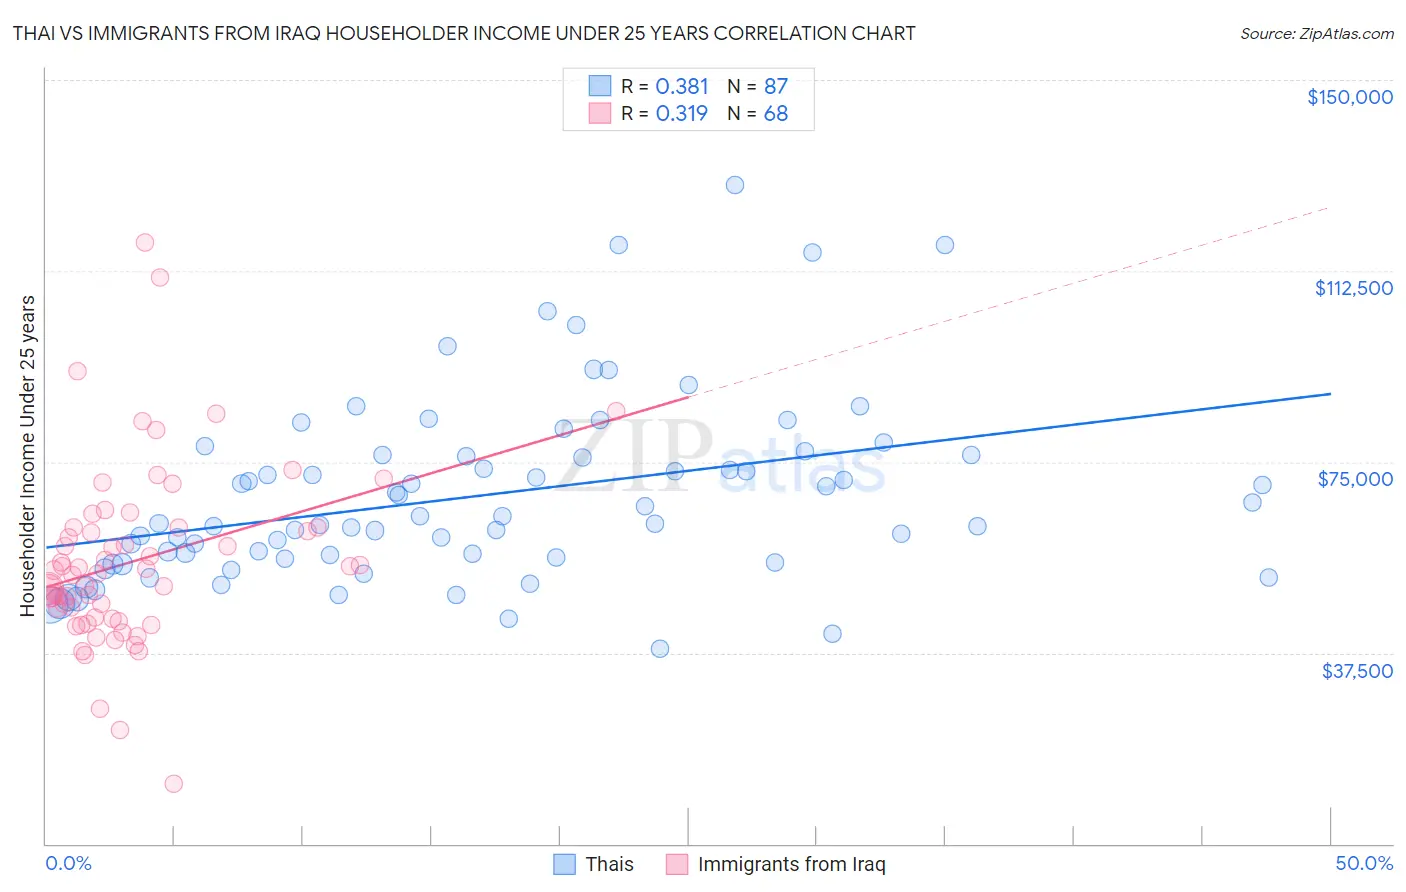
Thai vs Immigrants from Iraq Householder Income Under 25 years Correlation Chart
The statistical analysis conducted on geographies consisting of 390,520,827 people shows a mild positive correlation between the proportion of Thais and household income with householder under the age of 25 in the United States with a correlation coefficient (R) of 0.381 and weighted average of $59,187. Similarly, the statistical analysis conducted on geographies consisting of 177,702,127 people shows a mild positive correlation between the proportion of Immigrants from Iraq and household income with householder under the age of 25 in the United States with a correlation coefficient (R) of 0.319 and weighted average of $53,384, a difference of 10.9%.
Householder Income Under 25 years Correlation Summary
| Measurement | Thai | Immigrants from Iraq |
| Minimum | $38,359 | $11,835 |
| Maximum | $129,301 | $117,992 |
| Range | $90,942 | $106,157 |
| Mean | $68,286 | $55,491 |
| Median | $62,959 | $53,349 |
| Interquartile 25% (IQ1) | $56,029 | $44,386 |
| Interquartile 75% (IQ3) | $76,245 | $62,069 |
| Interquartile Range (IQR) | $20,216 | $17,683 |
| Standard Deviation (Sample) | $17,960 | $17,748 |
| Standard Deviation (Population) | $17,857 | $17,617 |
Similar Demographics by Householder Income Under 25 years
Demographics Similar to Thais by Householder Income Under 25 years
In terms of householder income under 25 years, the demographic groups most similar to Thais are Immigrants from Bolivia ($59,389, a difference of 0.34%), Immigrants from Taiwan ($59,424, a difference of 0.40%), Bolivian ($58,506, a difference of 1.2%), Immigrants from India ($59,914, a difference of 1.2%), and Indian (Asian) ($58,239, a difference of 1.6%).
| Demographics | Rating | Rank | Householder Income Under 25 years |
| Assyrians/Chaldeans/Syriacs | 100.0 /100 | #1 | Exceptional $65,329 |
| Immigrants | Hong Kong | 100.0 /100 | #2 | Exceptional $62,083 |
| Immigrants | India | 100.0 /100 | #3 | Exceptional $59,914 |
| Immigrants | Taiwan | 100.0 /100 | #4 | Exceptional $59,424 |
| Immigrants | Bolivia | 100.0 /100 | #5 | Exceptional $59,389 |
| Thais | 100.0 /100 | #6 | Exceptional $59,187 |
| Bolivians | 100.0 /100 | #7 | Exceptional $58,506 |
| Indians (Asian) | 100.0 /100 | #8 | Exceptional $58,239 |
| Chinese | 100.0 /100 | #9 | Exceptional $58,162 |
| Afghans | 100.0 /100 | #10 | Exceptional $58,019 |
| Immigrants | China | 100.0 /100 | #11 | Exceptional $57,931 |
| Immigrants | Philippines | 100.0 /100 | #12 | Exceptional $57,930 |
| Immigrants | South Central Asia | 100.0 /100 | #13 | Exceptional $57,818 |
| Filipinos | 100.0 /100 | #14 | Exceptional $57,740 |
| Koreans | 100.0 /100 | #15 | Exceptional $57,730 |
Demographics Similar to Immigrants from Iraq by Householder Income Under 25 years
In terms of householder income under 25 years, the demographic groups most similar to Immigrants from Iraq are Immigrants from Ethiopia ($53,408, a difference of 0.040%), Immigrants from Canada ($53,411, a difference of 0.050%), Colombian ($53,357, a difference of 0.050%), Guamanian/Chamorro ($53,423, a difference of 0.070%), and Italian ($53,426, a difference of 0.080%).
| Demographics | Rating | Rank | Householder Income Under 25 years |
| Immigrants | Spain | 96.6 /100 | #116 | Exceptional $53,560 |
| Lithuanians | 96.6 /100 | #117 | Exceptional $53,552 |
| Immigrants | Switzerland | 96.3 /100 | #118 | Exceptional $53,528 |
| Italians | 95.4 /100 | #119 | Exceptional $53,426 |
| Guamanians/Chamorros | 95.3 /100 | #120 | Exceptional $53,423 |
| Immigrants | Canada | 95.2 /100 | #121 | Exceptional $53,411 |
| Immigrants | Ethiopia | 95.2 /100 | #122 | Exceptional $53,408 |
| Immigrants | Iraq | 94.9 /100 | #123 | Exceptional $53,384 |
| Colombians | 94.6 /100 | #124 | Exceptional $53,357 |
| Pakistanis | 94.1 /100 | #125 | Exceptional $53,325 |
| Immigrants | Serbia | 94.1 /100 | #126 | Exceptional $53,321 |
| Immigrants | North America | 93.9 /100 | #127 | Exceptional $53,307 |
| Immigrants | Bulgaria | 93.9 /100 | #128 | Exceptional $53,305 |
| New Zealanders | 93.7 /100 | #129 | Exceptional $53,294 |
| Nicaraguans | 93.4 /100 | #130 | Exceptional $53,275 |