Immigrants from Vietnam vs Marshallese Median Household Income
COMPARE
Immigrants from Vietnam
Marshallese
Median Household Income
Median Household Income Comparison
Immigrants from Vietnam
Marshallese
$91,987
MEDIAN HOUSEHOLD INCOME
98.8/ 100
METRIC RATING
91st/ 347
METRIC RANK
$78,930
MEDIAN HOUSEHOLD INCOME
1.9/ 100
METRIC RATING
244th/ 347
METRIC RANK
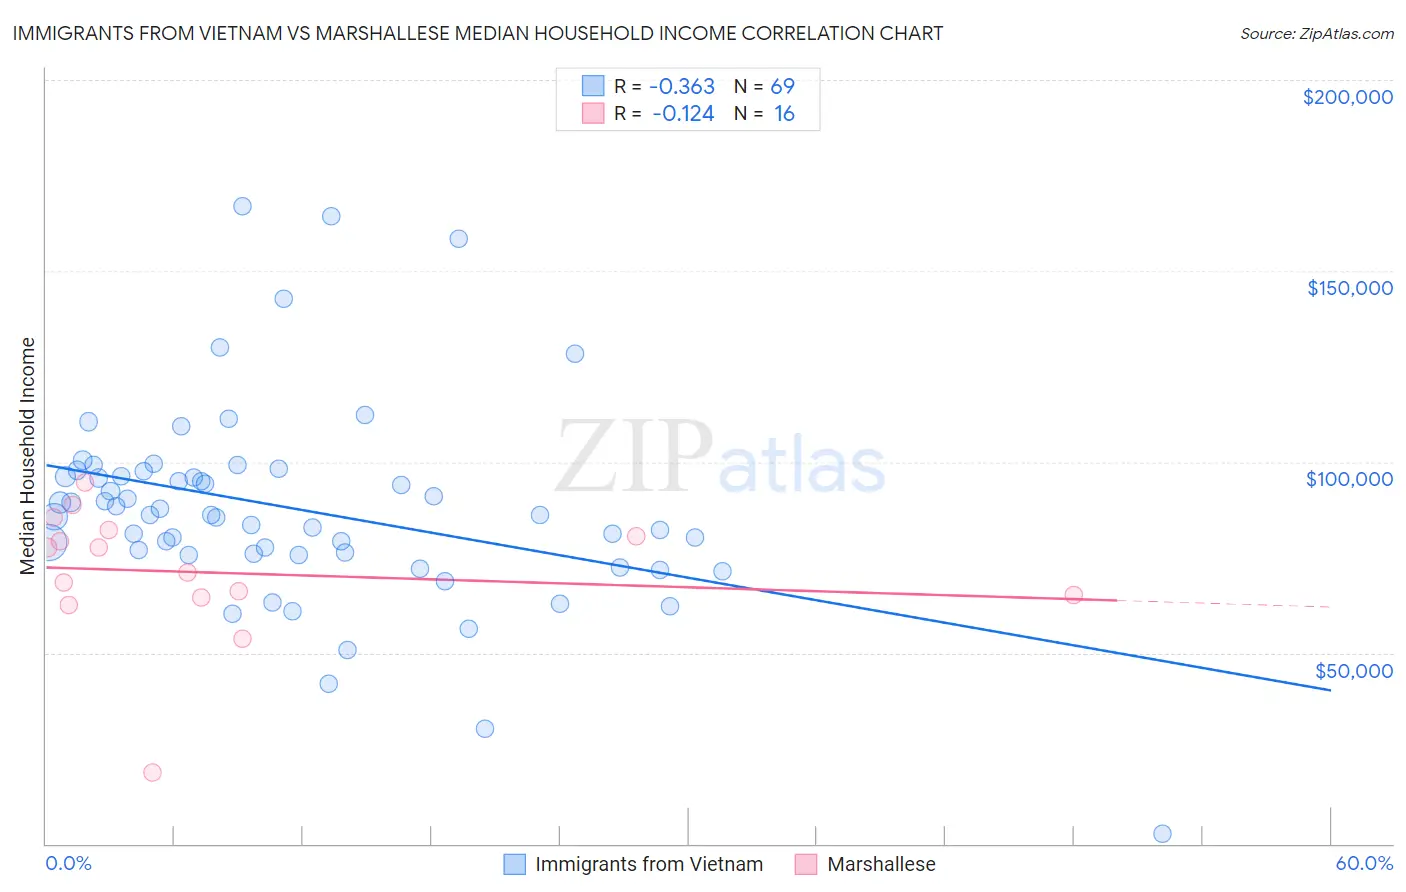
Immigrants from Vietnam vs Marshallese Median Household Income Correlation Chart
The statistical analysis conducted on geographies consisting of 404,446,933 people shows a mild negative correlation between the proportion of Immigrants from Vietnam and median household income in the United States with a correlation coefficient (R) of -0.363 and weighted average of $91,987. Similarly, the statistical analysis conducted on geographies consisting of 14,761,315 people shows a poor negative correlation between the proportion of Marshallese and median household income in the United States with a correlation coefficient (R) of -0.124 and weighted average of $78,930, a difference of 16.5%.
Median Household Income Correlation Summary
| Measurement | Immigrants from Vietnam | Marshallese |
| Minimum | $2,499 | $18,739 |
| Maximum | $166,850 | $94,608 |
| Range | $164,351 | $75,869 |
| Mean | $87,664 | $71,002 |
| Median | $86,139 | $74,280 |
| Interquartile 25% (IQ1) | $75,826 | $64,792 |
| Interquartile 75% (IQ3) | $96,947 | $81,406 |
| Interquartile Range (IQR) | $21,121 | $16,615 |
| Standard Deviation (Sample) | $26,629 | $17,620 |
| Standard Deviation (Population) | $26,435 | $17,060 |
Similar Demographics by Median Household Income
Demographics Similar to Immigrants from Vietnam by Median Household Income
In terms of median household income, the demographic groups most similar to Immigrants from Vietnam are Assyrian/Chaldean/Syriac ($91,991, a difference of 0.0%), Romanian ($91,994, a difference of 0.010%), Immigrants from Canada ($92,029, a difference of 0.050%), Immigrants from Western Europe ($91,936, a difference of 0.060%), and Immigrants from Lebanon ($91,887, a difference of 0.11%).
| Demographics | Rating | Rank | Median Household Income |
| Immigrants | Argentina | 99.1 /100 | #84 | Exceptional $92,417 |
| Immigrants | Croatia | 99.0 /100 | #85 | Exceptional $92,225 |
| Immigrants | England | 98.9 /100 | #86 | Exceptional $92,098 |
| Immigrants | Hungary | 98.9 /100 | #87 | Exceptional $92,094 |
| Immigrants | Canada | 98.8 /100 | #88 | Exceptional $92,029 |
| Romanians | 98.8 /100 | #89 | Exceptional $91,994 |
| Assyrians/Chaldeans/Syriacs | 98.8 /100 | #90 | Exceptional $91,991 |
| Immigrants | Vietnam | 98.8 /100 | #91 | Exceptional $91,987 |
| Immigrants | Western Europe | 98.8 /100 | #92 | Exceptional $91,936 |
| Immigrants | Lebanon | 98.7 /100 | #93 | Exceptional $91,887 |
| Immigrants | North America | 98.7 /100 | #94 | Exceptional $91,860 |
| Armenians | 98.7 /100 | #95 | Exceptional $91,807 |
| Jordanians | 98.7 /100 | #96 | Exceptional $91,794 |
| Immigrants | Serbia | 98.6 /100 | #97 | Exceptional $91,730 |
| Immigrants | Southern Europe | 98.5 /100 | #98 | Exceptional $91,605 |
Demographics Similar to Marshallese by Median Household Income
In terms of median household income, the demographic groups most similar to Marshallese are Immigrants from Barbados ($78,989, a difference of 0.080%), Inupiat ($78,841, a difference of 0.11%), Central American ($78,803, a difference of 0.16%), Immigrants from Sudan ($79,103, a difference of 0.22%), and Immigrants from Burma/Myanmar ($78,682, a difference of 0.32%).
| Demographics | Rating | Rank | Median Household Income |
| Nicaraguans | 3.1 /100 | #237 | Tragic $79,737 |
| Barbadians | 3.0 /100 | #238 | Tragic $79,664 |
| Alaska Natives | 2.7 /100 | #239 | Tragic $79,509 |
| Immigrants | Western Africa | 2.7 /100 | #240 | Tragic $79,490 |
| Immigrants | Nonimmigrants | 2.6 /100 | #241 | Tragic $79,429 |
| Immigrants | Sudan | 2.1 /100 | #242 | Tragic $79,103 |
| Immigrants | Barbados | 1.9 /100 | #243 | Tragic $78,989 |
| Marshallese | 1.9 /100 | #244 | Tragic $78,930 |
| Inupiat | 1.8 /100 | #245 | Tragic $78,841 |
| Central Americans | 1.7 /100 | #246 | Tragic $78,803 |
| Immigrants | Burma/Myanmar | 1.6 /100 | #247 | Tragic $78,682 |
| Sudanese | 1.5 /100 | #248 | Tragic $78,529 |
| West Indians | 1.4 /100 | #249 | Tragic $78,455 |
| Immigrants | Laos | 1.3 /100 | #250 | Tragic $78,327 |
| Mexican American Indians | 1.2 /100 | #251 | Tragic $78,166 |