Northern European vs Immigrants from Eastern Asia Householder Income Over 65 years
COMPARE
Northern European
Immigrants from Eastern Asia
Householder Income Over 65 years
Householder Income Over 65 years Comparison
Northern Europeans
Immigrants from Eastern Asia
$64,658
HOUSEHOLDER INCOME OVER 65 YEARS
97.9/ 100
METRIC RATING
83rd/ 347
METRIC RANK
$69,872
HOUSEHOLDER INCOME OVER 65 YEARS
100.0/ 100
METRIC RATING
21st/ 347
METRIC RANK
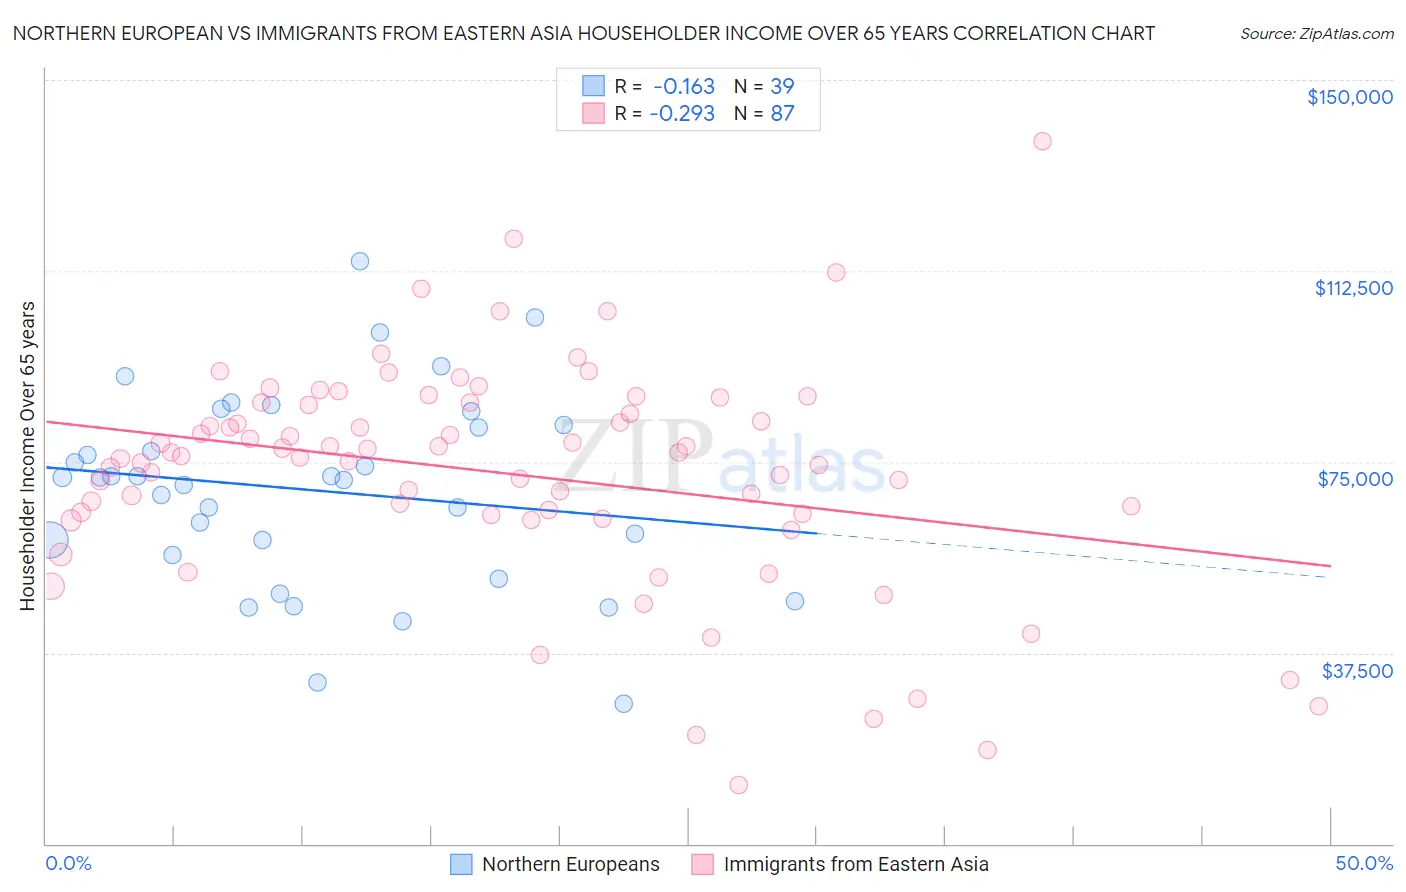
Northern European vs Immigrants from Eastern Asia Householder Income Over 65 years Correlation Chart
The statistical analysis conducted on geographies consisting of 404,945,292 people shows a poor negative correlation between the proportion of Northern Europeans and household income with householder over the age of 65 in the United States with a correlation coefficient (R) of -0.163 and weighted average of $64,658. Similarly, the statistical analysis conducted on geographies consisting of 497,045,213 people shows a weak negative correlation between the proportion of Immigrants from Eastern Asia and household income with householder over the age of 65 in the United States with a correlation coefficient (R) of -0.293 and weighted average of $69,872, a difference of 8.1%.
Householder Income Over 65 years Correlation Summary
| Measurement | Northern European | Immigrants from Eastern Asia |
| Minimum | $27,614 | $11,563 |
| Maximum | $114,286 | $137,919 |
| Range | $86,672 | $126,356 |
| Mean | $69,419 | $72,808 |
| Median | $71,954 | $76,112 |
| Interquartile 25% (IQ1) | $56,705 | $64,522 |
| Interquartile 75% (IQ3) | $82,250 | $86,562 |
| Interquartile Range (IQR) | $25,545 | $22,039 |
| Standard Deviation (Sample) | $19,142 | $22,168 |
| Standard Deviation (Population) | $18,895 | $22,041 |
Similar Demographics by Householder Income Over 65 years
Demographics Similar to Northern Europeans by Householder Income Over 65 years
In terms of householder income over 65 years, the demographic groups most similar to Northern Europeans are Immigrants from Greece ($64,636, a difference of 0.030%), Immigrants from Fiji ($64,795, a difference of 0.21%), Immigrants from Lebanon ($64,521, a difference of 0.21%), Immigrants from Russia ($64,512, a difference of 0.23%), and Immigrants from Europe ($64,828, a difference of 0.26%).
| Demographics | Rating | Rank | Householder Income Over 65 years |
| Ethiopians | 98.5 /100 | #76 | Exceptional $64,989 |
| Immigrants | Canada | 98.5 /100 | #77 | Exceptional $64,952 |
| Immigrants | Western Europe | 98.5 /100 | #78 | Exceptional $64,933 |
| Hawaiians | 98.4 /100 | #79 | Exceptional $64,920 |
| Immigrants | North America | 98.3 /100 | #80 | Exceptional $64,856 |
| Immigrants | Europe | 98.3 /100 | #81 | Exceptional $64,828 |
| Immigrants | Fiji | 98.2 /100 | #82 | Exceptional $64,795 |
| Northern Europeans | 97.9 /100 | #83 | Exceptional $64,658 |
| Immigrants | Greece | 97.9 /100 | #84 | Exceptional $64,636 |
| Immigrants | Lebanon | 97.6 /100 | #85 | Exceptional $64,521 |
| Immigrants | Russia | 97.6 /100 | #86 | Exceptional $64,512 |
| Austrians | 97.5 /100 | #87 | Exceptional $64,470 |
| Immigrants | Romania | 97.5 /100 | #88 | Exceptional $64,462 |
| Paraguayans | 97.4 /100 | #89 | Exceptional $64,443 |
| Immigrants | Kuwait | 97.4 /100 | #90 | Exceptional $64,433 |
Demographics Similar to Immigrants from Eastern Asia by Householder Income Over 65 years
In terms of householder income over 65 years, the demographic groups most similar to Immigrants from Eastern Asia are Immigrants from Israel ($69,857, a difference of 0.020%), Immigrants from Japan ($69,774, a difference of 0.14%), Immigrants from Sweden ($69,722, a difference of 0.22%), Immigrants from Belgium ($69,703, a difference of 0.24%), and Immigrants from South Central Asia ($70,103, a difference of 0.33%).
| Demographics | Rating | Rank | Householder Income Over 65 years |
| Burmese | 100.0 /100 | #14 | Exceptional $71,139 |
| Native Hawaiians | 100.0 /100 | #15 | Exceptional $71,021 |
| Okinawans | 100.0 /100 | #16 | Exceptional $70,846 |
| Immigrants | Korea | 100.0 /100 | #17 | Exceptional $70,696 |
| Eastern Europeans | 100.0 /100 | #18 | Exceptional $70,470 |
| Indians (Asian) | 100.0 /100 | #19 | Exceptional $70,238 |
| Immigrants | South Central Asia | 100.0 /100 | #20 | Exceptional $70,103 |
| Immigrants | Eastern Asia | 100.0 /100 | #21 | Exceptional $69,872 |
| Immigrants | Israel | 100.0 /100 | #22 | Exceptional $69,857 |
| Immigrants | Japan | 100.0 /100 | #23 | Exceptional $69,774 |
| Immigrants | Sweden | 100.0 /100 | #24 | Exceptional $69,722 |
| Immigrants | Belgium | 100.0 /100 | #25 | Exceptional $69,703 |
| Immigrants | Sri Lanka | 100.0 /100 | #26 | Exceptional $69,426 |
| Immigrants | Switzerland | 100.0 /100 | #27 | Exceptional $69,343 |
| Immigrants | China | 100.0 /100 | #28 | Exceptional $69,174 |