Swiss vs Ugandan High School Diploma
COMPARE
Swiss
Ugandan
High School Diploma
High School Diploma Comparison
Swiss
Ugandans
90.6%
HIGH SCHOOL DIPLOMA
98.6/ 100
METRIC RATING
92nd/ 347
METRIC RANK
89.7%
HIGH SCHOOL DIPLOMA
83.7/ 100
METRIC RATING
136th/ 347
METRIC RANK
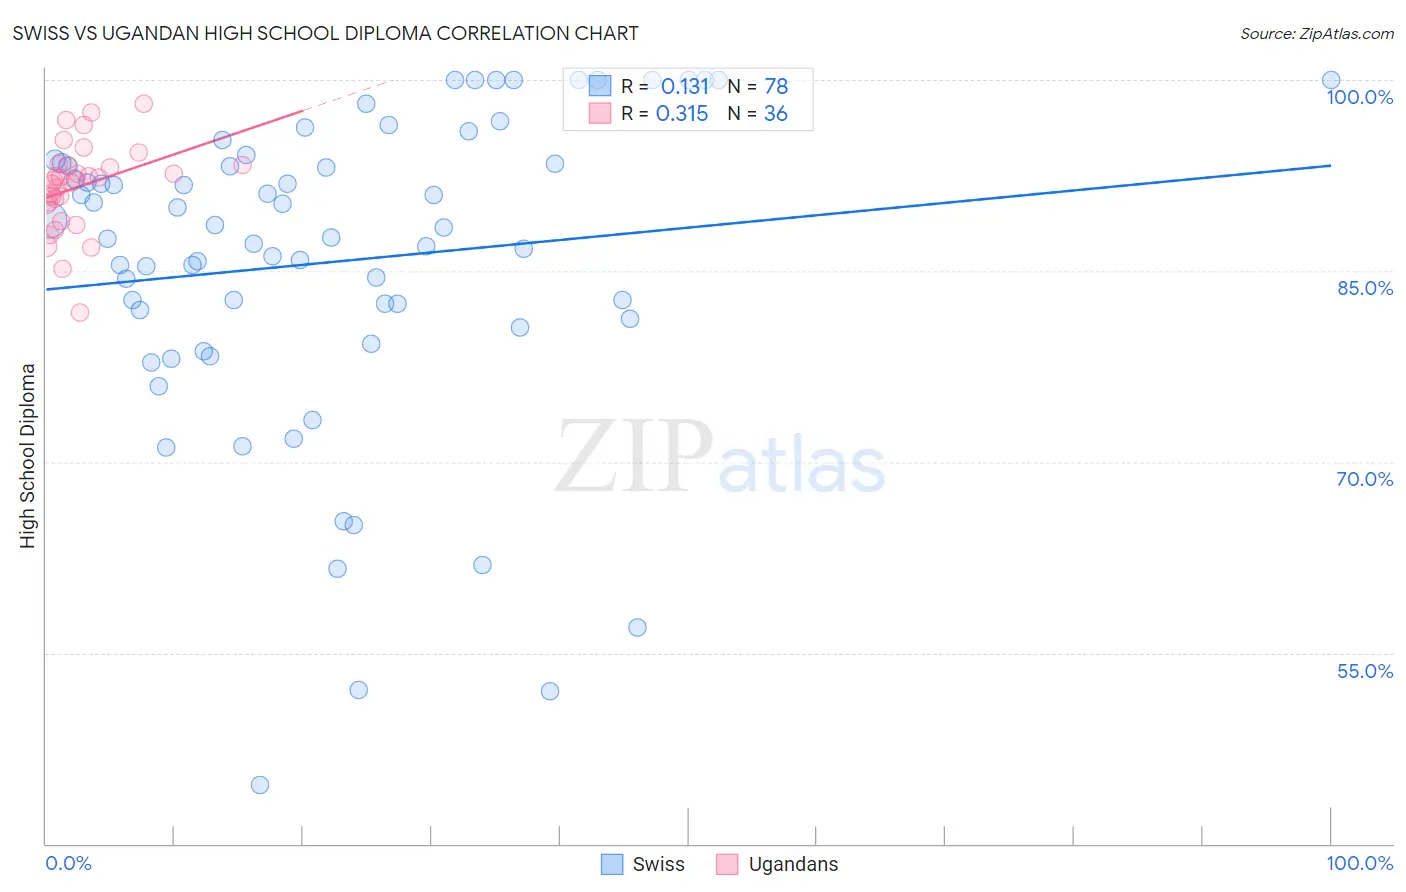
Swiss vs Ugandan High School Diploma Correlation Chart
The statistical analysis conducted on geographies consisting of 465,022,572 people shows a poor positive correlation between the proportion of Swiss and percentage of population with at least high school diploma education in the United States with a correlation coefficient (R) of 0.131 and weighted average of 90.6%. Similarly, the statistical analysis conducted on geographies consisting of 93,991,892 people shows a mild positive correlation between the proportion of Ugandans and percentage of population with at least high school diploma education in the United States with a correlation coefficient (R) of 0.315 and weighted average of 89.7%, a difference of 0.97%.
High School Diploma Correlation Summary
| Measurement | Swiss | Ugandan |
| Minimum | 44.6% | 81.7% |
| Maximum | 100.0% | 98.1% |
| Range | 55.4% | 16.4% |
| Mean | 85.7% | 91.6% |
| Median | 88.0% | 92.1% |
| Interquartile 25% (IQ1) | 81.2% | 90.3% |
| Interquartile 75% (IQ3) | 93.5% | 93.3% |
| Interquartile Range (IQR) | 12.2% | 3.0% |
| Standard Deviation (Sample) | 12.4% | 3.4% |
| Standard Deviation (Population) | 12.3% | 3.4% |
Similar Demographics by High School Diploma
Demographics Similar to Swiss by High School Diploma
In terms of high school diploma, the demographic groups most similar to Swiss are Immigrants from Western Europe (90.6%, a difference of 0.0%), South African (90.6%, a difference of 0.010%), Immigrants from Israel (90.5%, a difference of 0.020%), Celtic (90.6%, a difference of 0.030%), and Icelander (90.5%, a difference of 0.030%).
| Demographics | Rating | Rank | High School Diploma |
| Romanians | 98.9 /100 | #85 | Exceptional 90.7% |
| Immigrants | Bulgaria | 98.9 /100 | #86 | Exceptional 90.6% |
| Immigrants | Turkey | 98.9 /100 | #87 | Exceptional 90.6% |
| Immigrants | France | 98.8 /100 | #88 | Exceptional 90.6% |
| Canadians | 98.7 /100 | #89 | Exceptional 90.6% |
| Celtics | 98.7 /100 | #90 | Exceptional 90.6% |
| South Africans | 98.6 /100 | #91 | Exceptional 90.6% |
| Swiss | 98.6 /100 | #92 | Exceptional 90.6% |
| Immigrants | Western Europe | 98.6 /100 | #93 | Exceptional 90.6% |
| Immigrants | Israel | 98.5 /100 | #94 | Exceptional 90.5% |
| Icelanders | 98.5 /100 | #95 | Exceptional 90.5% |
| Immigrants | Serbia | 98.4 /100 | #96 | Exceptional 90.5% |
| Immigrants | Kuwait | 98.3 /100 | #97 | Exceptional 90.5% |
| Immigrants | Korea | 98.3 /100 | #98 | Exceptional 90.5% |
| Immigrants | Europe | 98.2 /100 | #99 | Exceptional 90.5% |
Demographics Similar to Ugandans by High School Diploma
In terms of high school diploma, the demographic groups most similar to Ugandans are Arab (89.7%, a difference of 0.0%), Assyrian/Chaldean/Syriac (89.7%, a difference of 0.030%), Chippewa (89.7%, a difference of 0.060%), Kenyan (89.6%, a difference of 0.060%), and Immigrants from Egypt (89.6%, a difference of 0.070%).
| Demographics | Rating | Rank | High School Diploma |
| Basques | 88.5 /100 | #129 | Excellent 89.8% |
| Immigrants | Ukraine | 87.9 /100 | #130 | Excellent 89.8% |
| Immigrants | Italy | 87.4 /100 | #131 | Excellent 89.8% |
| Immigrants | Bosnia and Herzegovina | 87.3 /100 | #132 | Excellent 89.8% |
| Albanians | 87.2 /100 | #133 | Excellent 89.8% |
| Immigrants | Jordan | 87.2 /100 | #134 | Excellent 89.8% |
| Chippewa | 85.6 /100 | #135 | Excellent 89.7% |
| Ugandans | 83.7 /100 | #136 | Excellent 89.7% |
| Arabs | 83.6 /100 | #137 | Excellent 89.7% |
| Assyrians/Chaldeans/Syriacs | 82.5 /100 | #138 | Excellent 89.7% |
| Kenyans | 81.4 /100 | #139 | Excellent 89.6% |
| Immigrants | Egypt | 81.2 /100 | #140 | Excellent 89.6% |
| Chileans | 79.0 /100 | #141 | Good 89.6% |
| Indians (Asian) | 78.8 /100 | #142 | Good 89.6% |
| Pakistanis | 78.3 /100 | #143 | Good 89.6% |