Immigrants from Eastern Asia vs Immigrants from Dominican Republic Householder Income Ages 25 - 44 years
COMPARE
Immigrants from Eastern Asia
Immigrants from Dominican Republic
Householder Income Ages 25 - 44 years
Householder Income Ages 25 - 44 years Comparison
Immigrants from Eastern Asia
Immigrants from Dominican Republic
$118,056
HOUSEHOLDER INCOME AGES 25 - 44 YEARS
100.0/ 100
METRIC RATING
13th/ 347
METRIC RANK
$80,319
HOUSEHOLDER INCOME AGES 25 - 44 YEARS
0.0/ 100
METRIC RATING
305th/ 347
METRIC RANK
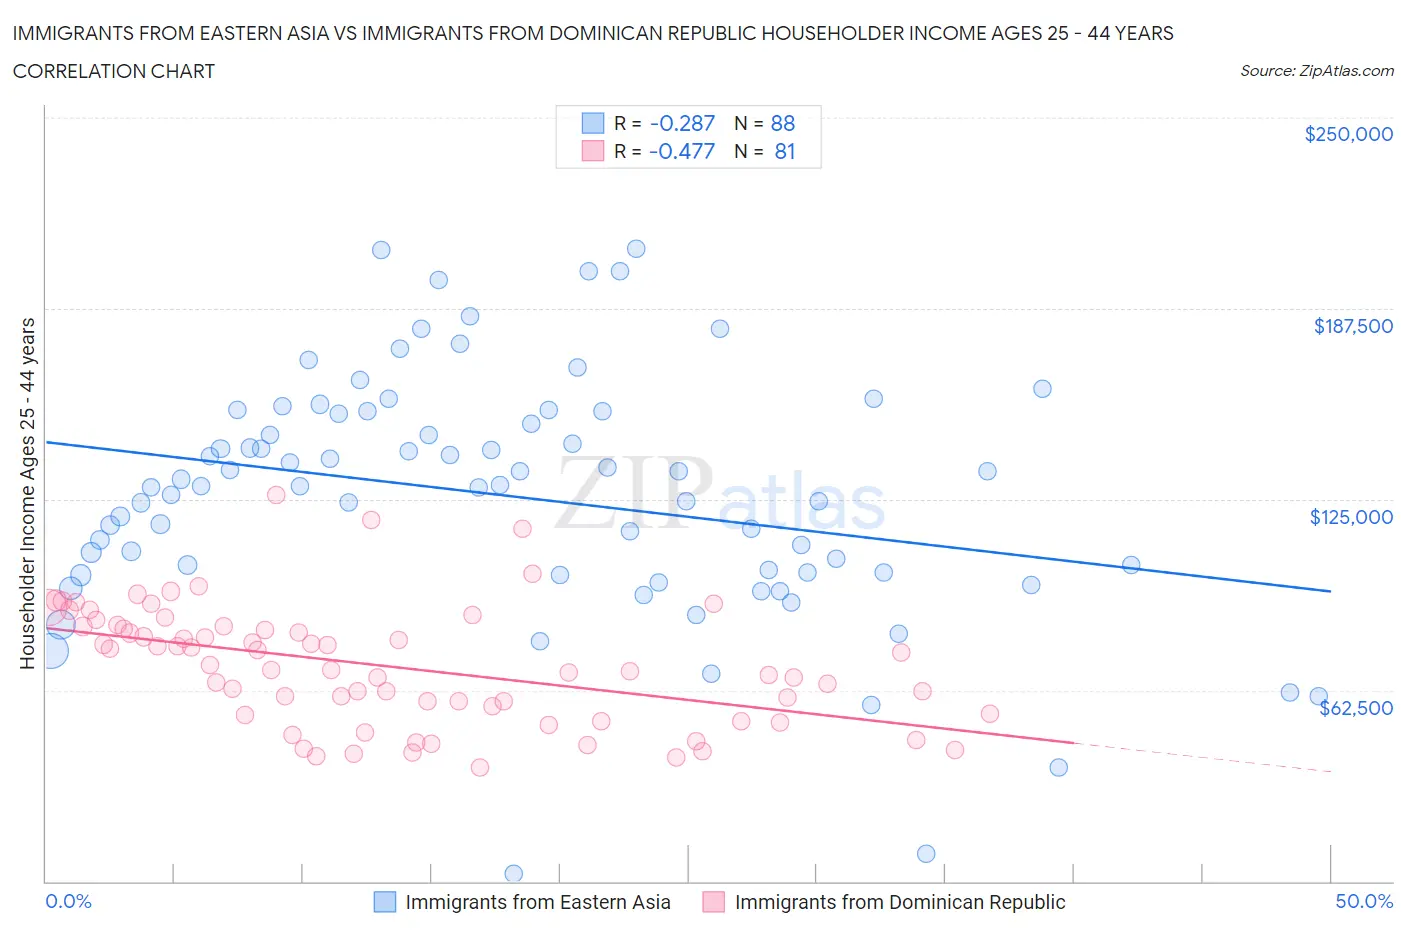
Immigrants from Eastern Asia vs Immigrants from Dominican Republic Householder Income Ages 25 - 44 years Correlation Chart
The statistical analysis conducted on geographies consisting of 497,761,527 people shows a weak negative correlation between the proportion of Immigrants from Eastern Asia and household income with householder between the ages 25 and 44 in the United States with a correlation coefficient (R) of -0.287 and weighted average of $118,056. Similarly, the statistical analysis conducted on geographies consisting of 274,672,798 people shows a moderate negative correlation between the proportion of Immigrants from Dominican Republic and household income with householder between the ages 25 and 44 in the United States with a correlation coefficient (R) of -0.477 and weighted average of $80,319, a difference of 47.0%.
Householder Income Ages 25 - 44 years Correlation Summary
| Measurement | Immigrants from Eastern Asia | Immigrants from Dominican Republic |
| Minimum | $2,499 | $37,215 |
| Maximum | $207,000 | $126,257 |
| Range | $204,501 | $89,042 |
| Mean | $126,047 | $70,454 |
| Median | $129,288 | $69,254 |
| Interquartile 25% (IQ1) | $101,055 | $54,727 |
| Interquartile 75% (IQ3) | $153,470 | $83,452 |
| Interquartile Range (IQR) | $52,415 | $28,725 |
| Standard Deviation (Sample) | $39,781 | $19,333 |
| Standard Deviation (Population) | $39,555 | $19,213 |
Similar Demographics by Householder Income Ages 25 - 44 years
Demographics Similar to Immigrants from Eastern Asia by Householder Income Ages 25 - 44 years
In terms of householder income ages 25 - 44 years, the demographic groups most similar to Immigrants from Eastern Asia are Immigrants from Israel ($117,219, a difference of 0.71%), Immigrants from Iran ($119,204, a difference of 0.97%), Okinawan ($119,349, a difference of 1.1%), Indian (Asian) ($119,496, a difference of 1.2%), and Immigrants from South Central Asia ($116,626, a difference of 1.2%).
| Demographics | Rating | Rank | Householder Income Ages 25 - 44 years |
| Thais | 100.0 /100 | #6 | Exceptional $121,778 |
| Immigrants | Ireland | 100.0 /100 | #7 | Exceptional $120,333 |
| Iranians | 100.0 /100 | #8 | Exceptional $120,292 |
| Immigrants | China | 100.0 /100 | #9 | Exceptional $119,756 |
| Indians (Asian) | 100.0 /100 | #10 | Exceptional $119,496 |
| Okinawans | 100.0 /100 | #11 | Exceptional $119,349 |
| Immigrants | Iran | 100.0 /100 | #12 | Exceptional $119,204 |
| Immigrants | Eastern Asia | 100.0 /100 | #13 | Exceptional $118,056 |
| Immigrants | Israel | 100.0 /100 | #14 | Exceptional $117,219 |
| Immigrants | South Central Asia | 100.0 /100 | #15 | Exceptional $116,626 |
| Cypriots | 100.0 /100 | #16 | Exceptional $116,364 |
| Immigrants | Australia | 100.0 /100 | #17 | Exceptional $115,947 |
| Eastern Europeans | 100.0 /100 | #18 | Exceptional $114,523 |
| Burmese | 100.0 /100 | #19 | Exceptional $113,701 |
| Immigrants | Korea | 100.0 /100 | #20 | Exceptional $113,401 |
Demographics Similar to Immigrants from Dominican Republic by Householder Income Ages 25 - 44 years
In terms of householder income ages 25 - 44 years, the demographic groups most similar to Immigrants from Dominican Republic are Immigrants from Caribbean ($80,326, a difference of 0.010%), Apache ($80,260, a difference of 0.070%), Mexican ($80,427, a difference of 0.13%), Hispanic or Latino ($80,515, a difference of 0.24%), and Immigrants from Micronesia ($80,544, a difference of 0.28%).
| Demographics | Rating | Rank | Householder Income Ages 25 - 44 years |
| Dominicans | 0.1 /100 | #298 | Tragic $81,229 |
| Immigrants | Liberia | 0.1 /100 | #299 | Tragic $80,863 |
| Cherokee | 0.0 /100 | #300 | Tragic $80,843 |
| Immigrants | Micronesia | 0.0 /100 | #301 | Tragic $80,544 |
| Hispanics or Latinos | 0.0 /100 | #302 | Tragic $80,515 |
| Mexicans | 0.0 /100 | #303 | Tragic $80,427 |
| Immigrants | Caribbean | 0.0 /100 | #304 | Tragic $80,326 |
| Immigrants | Dominican Republic | 0.0 /100 | #305 | Tragic $80,319 |
| Apache | 0.0 /100 | #306 | Tragic $80,260 |
| Haitians | 0.0 /100 | #307 | Tragic $80,055 |
| Immigrants | Central America | 0.0 /100 | #308 | Tragic $80,012 |
| Chippewa | 0.0 /100 | #309 | Tragic $80,005 |
| Fijians | 0.0 /100 | #310 | Tragic $79,956 |
| Indonesians | 0.0 /100 | #311 | Tragic $79,543 |
| Immigrants | Haiti | 0.0 /100 | #312 | Tragic $79,391 |