Immigrants from Switzerland vs Icelander Median Family Income
COMPARE
Immigrants from Switzerland
Icelander
Median Family Income
Median Family Income Comparison
Immigrants from Switzerland
Icelanders
$120,726
MEDIAN FAMILY INCOME
100.0/ 100
METRIC RATING
26th/ 347
METRIC RANK
$104,282
MEDIAN FAMILY INCOME
69.4/ 100
METRIC RATING
161st/ 347
METRIC RANK
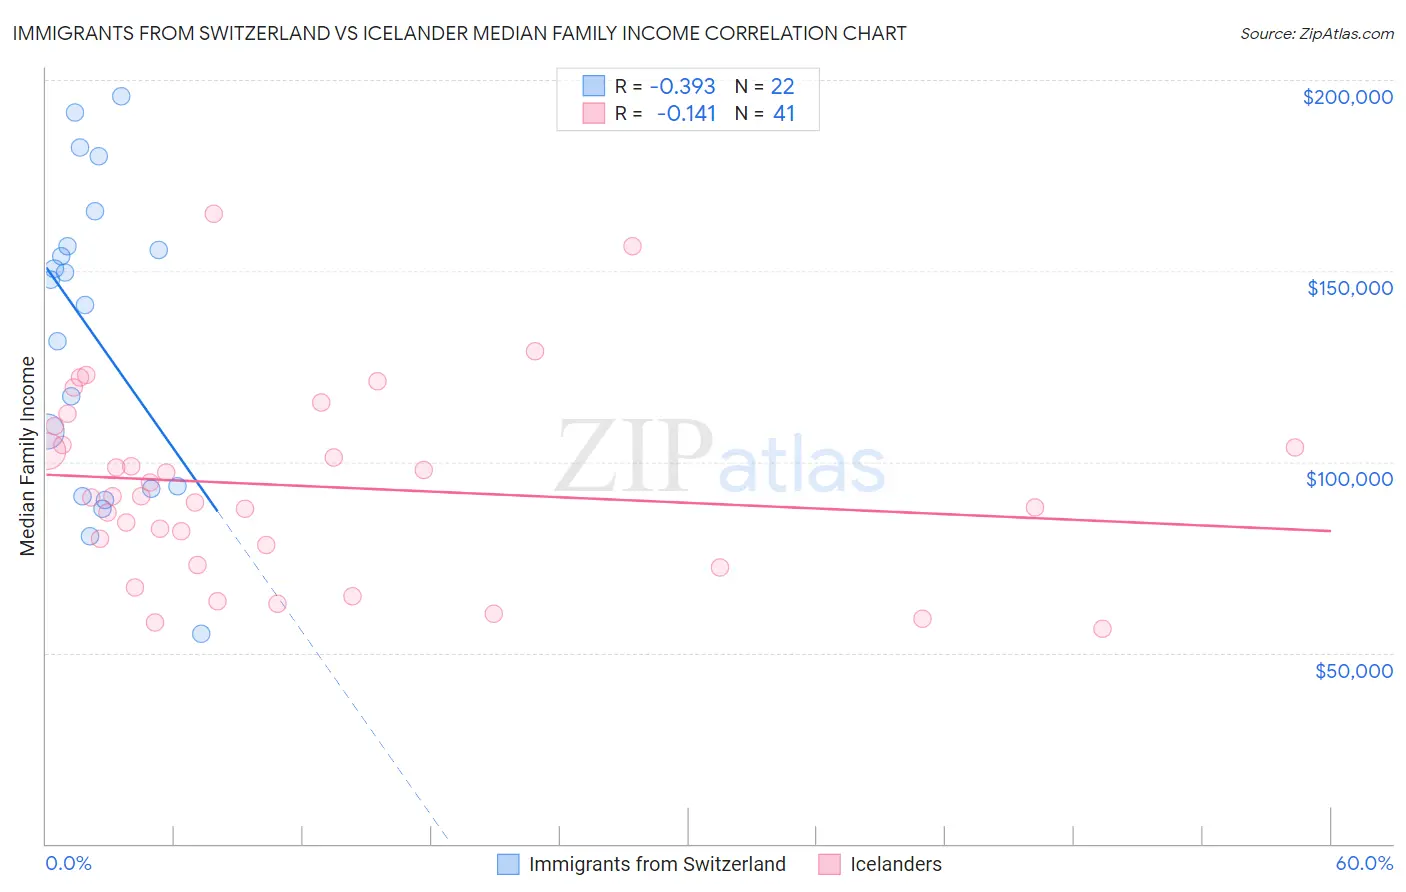
Immigrants from Switzerland vs Icelander Median Family Income Correlation Chart
The statistical analysis conducted on geographies consisting of 148,050,158 people shows a mild negative correlation between the proportion of Immigrants from Switzerland and median family income in the United States with a correlation coefficient (R) of -0.393 and weighted average of $120,726. Similarly, the statistical analysis conducted on geographies consisting of 159,597,543 people shows a poor negative correlation between the proportion of Icelanders and median family income in the United States with a correlation coefficient (R) of -0.141 and weighted average of $104,282, a difference of 15.8%.
Median Family Income Correlation Summary
| Measurement | Immigrants from Switzerland | Icelander |
| Minimum | $55,000 | $56,250 |
| Maximum | $195,586 | $165,003 |
| Range | $140,586 | $108,753 |
| Mean | $132,599 | $93,671 |
| Median | $144,292 | $90,899 |
| Interquartile 25% (IQ1) | $92,813 | $75,543 |
| Interquartile 75% (IQ3) | $156,420 | $106,880 |
| Interquartile Range (IQR) | $63,607 | $31,337 |
| Standard Deviation (Sample) | $40,204 | $25,058 |
| Standard Deviation (Population) | $39,280 | $24,750 |
Similar Demographics by Median Family Income
Demographics Similar to Immigrants from Switzerland by Median Family Income
In terms of median family income, the demographic groups most similar to Immigrants from Switzerland are Russian ($120,487, a difference of 0.20%), Immigrants from Denmark ($120,445, a difference of 0.23%), Latvian ($120,301, a difference of 0.35%), Turkish ($121,202, a difference of 0.39%), and Immigrants from Sri Lanka ($120,263, a difference of 0.39%).
| Demographics | Rating | Rank | Median Family Income |
| Immigrants | Belgium | 100.0 /100 | #19 | Exceptional $123,831 |
| Burmese | 100.0 /100 | #20 | Exceptional $123,369 |
| Immigrants | Korea | 100.0 /100 | #21 | Exceptional $122,800 |
| Immigrants | Sweden | 100.0 /100 | #22 | Exceptional $122,765 |
| Immigrants | Japan | 100.0 /100 | #23 | Exceptional $122,764 |
| Immigrants | Northern Europe | 100.0 /100 | #24 | Exceptional $121,840 |
| Turks | 100.0 /100 | #25 | Exceptional $121,202 |
| Immigrants | Switzerland | 100.0 /100 | #26 | Exceptional $120,726 |
| Russians | 100.0 /100 | #27 | Exceptional $120,487 |
| Immigrants | Denmark | 100.0 /100 | #28 | Exceptional $120,445 |
| Latvians | 100.0 /100 | #29 | Exceptional $120,301 |
| Immigrants | Sri Lanka | 100.0 /100 | #30 | Exceptional $120,263 |
| Immigrants | France | 100.0 /100 | #31 | Exceptional $120,076 |
| Asians | 100.0 /100 | #32 | Exceptional $119,955 |
| Bhutanese | 100.0 /100 | #33 | Exceptional $119,800 |
Demographics Similar to Icelanders by Median Family Income
In terms of median family income, the demographic groups most similar to Icelanders are Scottish ($104,288, a difference of 0.010%), Swiss ($104,396, a difference of 0.11%), Scandinavian ($104,410, a difference of 0.12%), Moroccan ($104,488, a difference of 0.20%), and Immigrants from Sierra Leone ($103,990, a difference of 0.28%).
| Demographics | Rating | Rank | Median Family Income |
| Immigrants | Nepal | 76.3 /100 | #154 | Good $104,966 |
| Native Hawaiians | 75.8 /100 | #155 | Good $104,910 |
| Basques | 74.4 /100 | #156 | Good $104,760 |
| Moroccans | 71.6 /100 | #157 | Good $104,488 |
| Scandinavians | 70.8 /100 | #158 | Good $104,410 |
| Swiss | 70.7 /100 | #159 | Good $104,396 |
| Scottish | 69.5 /100 | #160 | Good $104,288 |
| Icelanders | 69.4 /100 | #161 | Good $104,282 |
| Immigrants | Sierra Leone | 66.2 /100 | #162 | Good $103,990 |
| Costa Ricans | 66.2 /100 | #163 | Good $103,989 |
| Sierra Leoneans | 64.7 /100 | #164 | Good $103,859 |
| Slovaks | 63.1 /100 | #165 | Good $103,729 |
| English | 62.6 /100 | #166 | Good $103,684 |
| South American Indians | 61.9 /100 | #167 | Good $103,624 |
| Immigrants | Peru | 60.8 /100 | #168 | Good $103,534 |