Sri Lankan vs Immigrants from the Azores 12th Grade, No Diploma

COMPARE

Sri Lankan
Race
Ancestry
AfghanAfricanAlaska NativeAlaskan AthabascanAlbanianAleutAlsatianAmericanApacheArabArapahoArgentineanArmenianAssyrian/Chaldean/SyriacAustralianAustrianBahamianBangladeshiBarbadianBasqueBelgianBelizeanBermudanBhutaneseBlackfeetBolivianBrazilianBritishBritish West IndianBulgarianBurmeseCajunCambodianCanadianCape VerdeanCarpatho RusynCelticCentral AmericanCentral American IndianCherokeeCheyenneChickasawChileanChineseChippewaChoctawColombianColvilleComancheCosta RicanCreeCreekCroatianCrowCubanCypriotCzechCzechoslovakianDanishDelawareDominicanDutchDutch West IndianEastern EuropeanEcuadorianEgyptianEnglishEstonianEthiopianEuropeanFijianFilipinoFinnishFrenchFrench American IndianFrench CanadianGermanGerman RussianGhanaianGreekGuamanian/ChamorroGuatemalanGuyaneseHaitianHmongHonduranHopiHoumaHungarianIcelanderIndian (Asian)IndonesianInupiatIranianIraqiIrishIroquoisIsraeliItalianJamaicanJapaneseJordanianKenyanKiowaKoreanLaotianLatvianLebaneseLiberianLithuanianLumbeeLuxembourgerMacedonianMalaysianMalteseMarshalleseMenomineeMexicanMexican American IndianMongolianMoroccanNative HawaiianNavajoNepaleseNew ZealanderNicaraguanNigerianNorthern EuropeanNorwegianOkinawanOsageOttawaPaiutePakistaniPalestinianPanamanianParaguayanPennsylvania GermanPeruvianPimaPolishPortuguesePotawatomiPuebloPuerto RicanPuget Sound SalishRomanianRussianSalvadoranSamoanScandinavianScotch-IrishScottishSeminoleSenegaleseSerbianShoshoneSierra LeoneanSiouxSlavicSlovakSloveneSomaliSouth AfricanSouth AmericanSouth American IndianSoviet UnionSpaniardSpanishSpanish AmericanSpanish American IndianSri LankanSubsaharan AfricanSudaneseSwedishSwissSyrianTaiwaneseThaiTlingit-HaidaTohono O'OdhamTonganTrinidadian and TobagonianTsimshianTurkishU.S. Virgin IslanderUgandanUkrainianUruguayanUteVenezuelanVietnameseWelshWest IndianYakamaYaquiYugoslavianYumanYup'ikZimbabwean
Immigration
NonimmigrantsImmigrantsAfghanistanAfricaAlbaniaArgentinaArmeniaAsiaAustraliaAustriaBahamasBangladeshBarbadosBelarusBelgiumBelizeBoliviaBosnia and HerzegovinaBrazilBulgariaBurma/MyanmarCabo VerdeCambodiaCameroonCanadaCaribbeanCentral AmericaChileChinaColombiaCongoCosta RicaCroatiaCubaCzechoslovakiaDenmarkDominicaDominican RepublicEastern AfricaEastern AsiaEastern EuropeEcuadorEgyptEl SalvadorEnglandEritreaEthiopiaEuropeFijiFranceGermanyGhanaGreeceGrenadaGuatemalaGuyanaHaitiHondurasHong KongHungaryIndiaIndonesiaIranIraqIrelandIsraelItalyJamaicaJapanJordanKazakhstanKenyaKoreaKuwaitLaosLatin AmericaLatviaLebanonLiberiaLithuaniaMalaysiaMexicoMicronesiaMiddle AfricaMoldovaMoroccoNepalNetherlandsNicaraguaNigeriaNorth AmericaNorth MacedoniaNorthern AfricaNorthern EuropeNorwayOceaniaPakistanPanamaPeruPhilippinesPolandPortugalRomaniaRussiaSaudi ArabiaScotlandSenegalSerbiaSierra LeoneSingaporeSomaliaSouth AfricaSouth AmericaSouth Central AsiaSouth Eastern AsiaSouthern EuropeSpainSri LankaSt. Vincent and the GrenadinesSudanSwedenSwitzerlandSyriaTaiwanThailandTrinidad and TobagoTurkeyUgandaUkraineUruguayUzbekistanVenezuelaVietnamWest IndiesWestern AfricaWestern AsiaWestern EuropeYemenZaireZimbabwe
Immigrants from the Azores
Race
Ancestry
AfghanAfricanAlaska NativeAlaskan AthabascanAlbanianAleutAlsatianAmericanApacheArabArapahoArgentineanArmenianAssyrian/Chaldean/SyriacAustralianAustrianBahamianBangladeshiBarbadianBasqueBelgianBelizeanBermudanBhutaneseBlackfeetBolivianBrazilianBritishBritish West IndianBulgarianBurmeseCajunCambodianCanadianCape VerdeanCarpatho RusynCelticCentral AmericanCentral American IndianCherokeeCheyenneChickasawChileanChineseChippewaChoctawColombianColvilleComancheCosta RicanCreeCreekCroatianCrowCubanCypriotCzechCzechoslovakianDanishDelawareDominicanDutchDutch West IndianEastern EuropeanEcuadorianEgyptianEnglishEstonianEthiopianEuropeanFijianFilipinoFinnishFrenchFrench American IndianFrench CanadianGermanGerman RussianGhanaianGreekGuamanian/ChamorroGuatemalanGuyaneseHaitianHmongHonduranHopiHoumaHungarianIcelanderIndian (Asian)IndonesianInupiatIranianIraqiIrishIroquoisIsraeliItalianJamaicanJapaneseJordanianKenyanKiowaKoreanLaotianLatvianLebaneseLiberianLithuanianLumbeeLuxembourgerMacedonianMalaysianMalteseMarshalleseMenomineeMexicanMexican American IndianMongolianMoroccanNative HawaiianNavajoNepaleseNew ZealanderNicaraguanNigerianNorthern EuropeanNorwegianOkinawanOsageOttawaPaiutePakistaniPalestinianPanamanianParaguayanPennsylvania GermanPeruvianPimaPolishPortuguesePotawatomiPuebloPuerto RicanPuget Sound SalishRomanianRussianSalvadoranSamoanScandinavianScotch-IrishScottishSeminoleSenegaleseSerbianShoshoneSierra LeoneanSiouxSlavicSlovakSloveneSomaliSouth AfricanSouth AmericanSouth American IndianSoviet UnionSpaniardSpanishSpanish AmericanSpanish American IndianSubsaharan AfricanSudaneseSwedishSwissSyrianTaiwaneseThaiTlingit-HaidaTohono O'OdhamTonganTrinidadian and TobagonianTsimshianTurkishU.S. Virgin IslanderUgandanUkrainianUruguayanUteVenezuelanVietnameseWelshWest IndianYakamaYaquiYugoslavianYumanYup'ikZimbabwean
Immigration
NonimmigrantsImmigrantsAfghanistanAfricaAlbaniaArgentinaArmeniaAsiaAustraliaAustriaBahamasBangladeshBarbadosBelarusBelgiumBelizeBoliviaBosnia and HerzegovinaBrazilBulgariaBurma/MyanmarCabo VerdeCambodiaCameroonCanadaCaribbeanCentral AmericaChileChinaColombiaCongoCosta RicaCroatiaCubaCzechoslovakiaDenmarkDominicaDominican RepublicEastern AfricaEastern AsiaEastern EuropeEcuadorEgyptEl SalvadorEnglandEritreaEthiopiaEuropeFijiFranceGermanyGhanaGreeceGrenadaGuatemalaGuyanaHaitiHondurasHong KongHungaryIndiaIndonesiaIranIraqIrelandIsraelItalyJamaicaJapanJordanKazakhstanKenyaKoreaKuwaitLaosLatin AmericaLatviaLebanonLiberiaLithuaniaMalaysiaMexicoMicronesiaMiddle AfricaMoldovaMoroccoNepalNetherlandsNicaraguaNigeriaNorth AmericaNorth MacedoniaNorthern AfricaNorthern EuropeNorwayOceaniaPakistanPanamaPeruPhilippinesPolandPortugalRomaniaRussiaSaudi ArabiaScotlandSenegalSerbiaSierra LeoneSingaporeSomaliaSouth AfricaSouth AmericaSouth Central AsiaSouth Eastern AsiaSouthern EuropeSpainSri LankaSt. Vincent and the GrenadinesSudanSwedenSwitzerlandSyriaTaiwanThailandTrinidad and TobagoTurkeyUgandaUkraineUruguayUzbekistanVenezuelaVietnamWest IndiesWestern AfricaWestern AsiaWestern EuropeYemenZaireZimbabweAzores
12th Grade, No Diploma
Income
Poverty
Unemployment
Labor Participation
Family Structure
Vehicle Availability
Education Level
Disability

12th Grade, No Diploma Comparison

Sri Lankans

Immigrants from the Azores

Tragic
Tragic
89.4%
12TH GRADE, NO DIPLOMA
0.2/ 100
METRIC RATING
264th/ 347
METRIC RANK
85.3%
12TH GRADE, NO DIPLOMA
0.0/ 100
METRIC RATING
330th/ 347
METRIC RANK

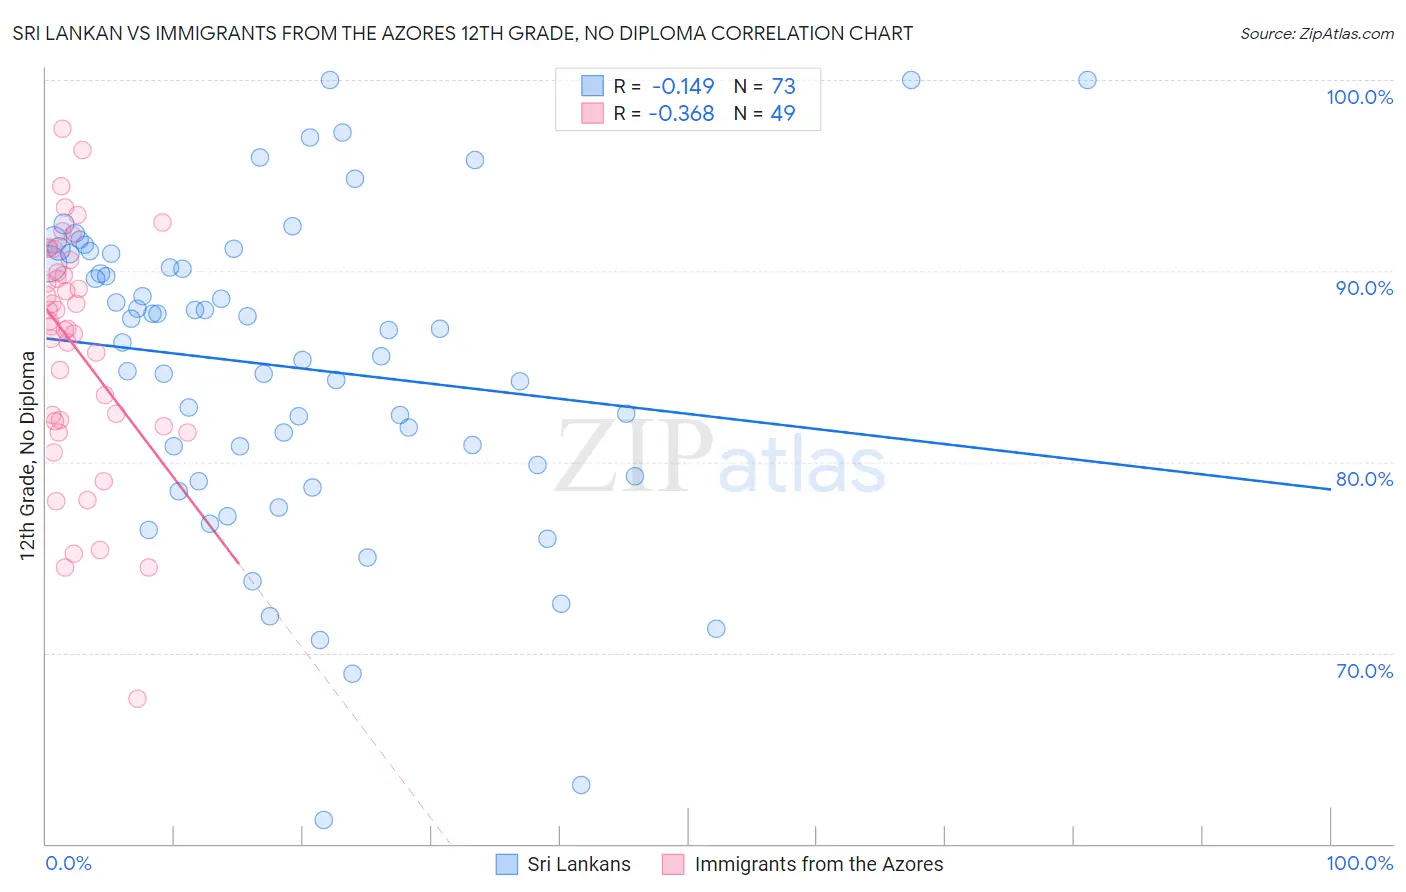
Sri Lankan vs Immigrants from the Azores 12th Grade, No Diploma Correlation Chart

The statistical analysis conducted on geographies consisting of 440,593,537 people shows a poor negative correlation between the proportion of Sri Lankans and percentage of population with at least 12th grade (no diploma) education in the United States with a correlation coefficient (R) of -0.149 and weighted average of 89.4%. Similarly, the statistical analysis conducted on geographies consisting of 46,257,310 people shows a mild negative correlation between the proportion of Immigrants from the Azores and percentage of population with at least 12th grade (no diploma) education in the United States with a correlation coefficient (R) of -0.368 and weighted average of 85.3%, a difference of 4.8%.
Sri Lankan vs Immigrants from the Azores 12th Grade, No Diploma

12th Grade, No Diploma Correlation Summary

MeasurementSri LankanImmigrants from the Azores
Minimum61.2%67.6%
Maximum100.0%97.5%
Range38.8%29.9%
Mean85.0%85.9%
Median86.9%87.1%
Interquartile 25% (IQ1)79.6%82.0%
Interquartile 75% (IQ3)90.9%90.2%
Interquartile Range (IQR)11.3%8.2%
Standard Deviation (Sample)8.2%6.3%
Standard Deviation (Population)8.2%6.2%

Similar Demographics by 12th Grade, No Diploma

Demographics Similar to Sri Lankans by 12th Grade, No Diploma

In terms of 12th grade, no diploma, the demographic groups most similar to Sri Lankans are Trinidadian and Tobagonian (89.4%, a difference of 0.010%), Immigrants from Jamaica (89.5%, a difference of 0.040%), Seminole (89.4%, a difference of 0.090%), West Indian (89.3%, a difference of 0.090%), and Immigrants from Trinidad and Tobago (89.3%, a difference of 0.11%).
DemographicsRating | Rank12th Grade, No Diploma
Jamaicans
0.5
/100
|
#257
Tragic
89.7%
Africans
0.4
/100
|
#258
Tragic
89.6%
Immigrants | Western Africa
0.4
/100
|
#259
Tragic
89.6%
Immigrants | South Eastern Asia
0.4
/100
|
#260
Tragic
89.6%
Cheyenne
0.4
/100
|
#261
Tragic
89.6%
Sioux
0.4
/100
|
#262
Tragic
89.6%
Immigrants | Jamaica
0.2
/100
|
#263
Tragic
89.5%
Sri Lankans
0.2
/100
|
#264
Tragic
89.4%
Trinidadians and Tobagonians
0.2
/100
|
#265
Tragic
89.4%
Seminole
0.2
/100
|
#266
Tragic
89.4%
West Indians
0.2
/100
|
#267
Tragic
89.3%
Immigrants | Trinidad and Tobago
0.1
/100
|
#268
Tragic
89.3%
U.S. Virgin Islanders
0.1
/100
|
#269
Tragic
89.3%
Bangladeshis
0.1
/100
|
#270
Tragic
89.3%
Blacks/African Americans
0.1
/100
|
#271
Tragic
89.3%

Demographics Similar to Immigrants from the Azores by 12th Grade, No Diploma

In terms of 12th grade, no diploma, the demographic groups most similar to Immigrants from the Azores are Hispanic or Latino (85.4%, a difference of 0.14%), Central American (85.2%, a difference of 0.14%), Honduran (85.5%, a difference of 0.23%), Immigrants from Honduras (85.0%, a difference of 0.35%), and Lumbee (85.7%, a difference of 0.42%).
DemographicsRating | Rank12th Grade, No Diploma
Yuman
0.0
/100
|
#323
Tragic
86.5%
Immigrants | Cabo Verde
0.0
/100
|
#324
Tragic
85.8%
Mexican American Indians
0.0
/100
|
#325
Tragic
85.7%
Dominicans
0.0
/100
|
#326
Tragic
85.7%
Lumbee
0.0
/100
|
#327
Tragic
85.7%
Hondurans
0.0
/100
|
#328
Tragic
85.5%
Hispanics or Latinos
0.0
/100
|
#329
Tragic
85.4%
Immigrants | Azores
0.0
/100
|
#330
Tragic
85.3%
Central Americans
0.0
/100
|
#331
Tragic
85.2%
Immigrants | Honduras
0.0
/100
|
#332
Tragic
85.0%
Immigrants | Latin America
0.0
/100
|
#333
Tragic
85.0%
Immigrants | Dominican Republic
0.0
/100
|
#334
Tragic
84.9%
Immigrants | Yemen
0.0
/100
|
#335
Tragic
84.8%
Tohono O'odham
0.0
/100
|
#336
Tragic
84.7%
Pima
0.0
/100
|
#337
Tragic
84.6%