Spanish American vs Liberian Householder Income Over 65 years
COMPARE
Spanish American
Liberian
Householder Income Over 65 years
Householder Income Over 65 years Comparison
Spanish Americans
Liberians
$57,021
HOUSEHOLDER INCOME OVER 65 YEARS
1.6/ 100
METRIC RATING
235th/ 347
METRIC RANK
$54,356
HOUSEHOLDER INCOME OVER 65 YEARS
0.1/ 100
METRIC RATING
271st/ 347
METRIC RANK
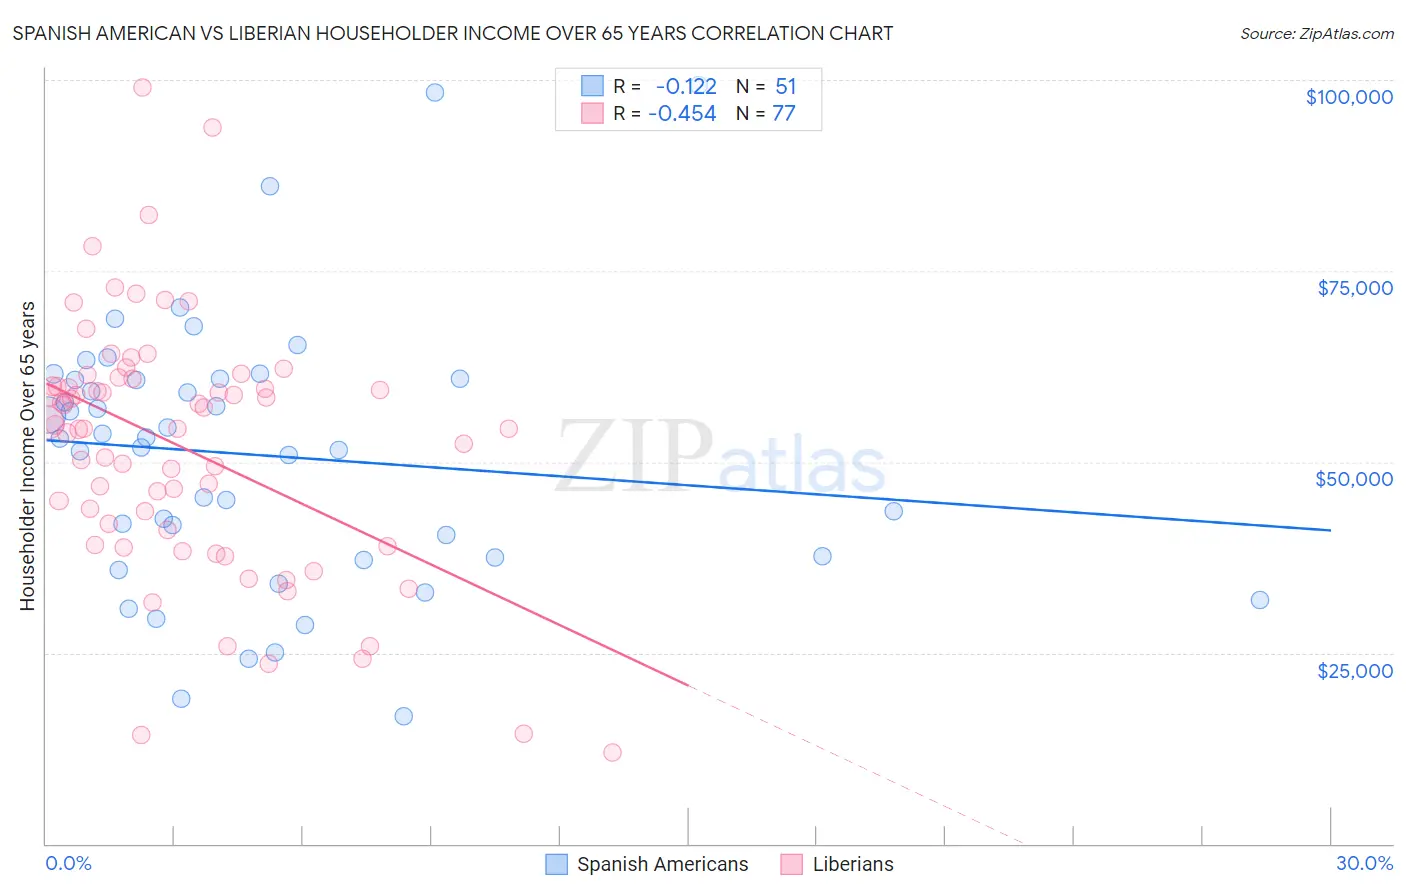
Spanish American vs Liberian Householder Income Over 65 years Correlation Chart
The statistical analysis conducted on geographies consisting of 103,119,527 people shows a poor negative correlation between the proportion of Spanish Americans and household income with householder over the age of 65 in the United States with a correlation coefficient (R) of -0.122 and weighted average of $57,021. Similarly, the statistical analysis conducted on geographies consisting of 117,884,771 people shows a moderate negative correlation between the proportion of Liberians and household income with householder over the age of 65 in the United States with a correlation coefficient (R) of -0.454 and weighted average of $54,356, a difference of 4.9%.
Householder Income Over 65 years Correlation Summary
| Measurement | Spanish American | Liberian |
| Minimum | $16,667 | $12,021 |
| Maximum | $99,316 | $98,942 |
| Range | $82,649 | $86,921 |
| Mean | $50,862 | $51,904 |
| Median | $53,029 | $54,398 |
| Interquartile 25% (IQ1) | $37,400 | $40,027 |
| Interquartile 75% (IQ3) | $60,833 | $60,409 |
| Interquartile Range (IQR) | $23,433 | $20,383 |
| Standard Deviation (Sample) | $17,582 | $16,445 |
| Standard Deviation (Population) | $17,409 | $16,338 |
Similar Demographics by Householder Income Over 65 years
Demographics Similar to Spanish Americans by Householder Income Over 65 years
In terms of householder income over 65 years, the demographic groups most similar to Spanish Americans are Immigrants from Uruguay ($56,975, a difference of 0.080%), Immigrants from Panama ($56,944, a difference of 0.14%), Immigrants from Burma/Myanmar ($57,114, a difference of 0.16%), Immigrants from Western Africa ($57,119, a difference of 0.17%), and Fijian ($56,768, a difference of 0.45%).
| Demographics | Rating | Rank | Householder Income Over 65 years |
| Immigrants | Albania | 3.6 /100 | #228 | Tragic $57,828 |
| Immigrants | Colombia | 3.0 /100 | #229 | Tragic $57,658 |
| Immigrants | Cambodia | 2.8 /100 | #230 | Tragic $57,580 |
| Immigrants | Nonimmigrants | 2.4 /100 | #231 | Tragic $57,426 |
| Immigrants | Venezuela | 2.3 /100 | #232 | Tragic $57,371 |
| Immigrants | Western Africa | 1.7 /100 | #233 | Tragic $57,119 |
| Immigrants | Burma/Myanmar | 1.7 /100 | #234 | Tragic $57,114 |
| Spanish Americans | 1.6 /100 | #235 | Tragic $57,021 |
| Immigrants | Uruguay | 1.5 /100 | #236 | Tragic $56,975 |
| Immigrants | Panama | 1.5 /100 | #237 | Tragic $56,944 |
| Fijians | 1.2 /100 | #238 | Tragic $56,768 |
| Immigrants | Laos | 1.2 /100 | #239 | Tragic $56,722 |
| Sub-Saharan Africans | 1.0 /100 | #240 | Tragic $56,615 |
| Immigrants | Guyana | 0.9 /100 | #241 | Tragic $56,495 |
| Yaqui | 0.8 /100 | #242 | Tragic $56,417 |
Demographics Similar to Liberians by Householder Income Over 65 years
In terms of householder income over 65 years, the demographic groups most similar to Liberians are Immigrants from Senegal ($54,447, a difference of 0.17%), Nicaraguan ($54,474, a difference of 0.22%), Potawatomi ($54,212, a difference of 0.27%), Immigrants from Zaire ($54,512, a difference of 0.29%), and Guatemalan ($54,526, a difference of 0.31%).
| Demographics | Rating | Rank | Householder Income Over 65 years |
| Apache | 0.1 /100 | #264 | Tragic $54,668 |
| Belizeans | 0.1 /100 | #265 | Tragic $54,580 |
| Jamaicans | 0.1 /100 | #266 | Tragic $54,560 |
| Guatemalans | 0.1 /100 | #267 | Tragic $54,526 |
| Immigrants | Zaire | 0.1 /100 | #268 | Tragic $54,512 |
| Nicaraguans | 0.1 /100 | #269 | Tragic $54,474 |
| Immigrants | Senegal | 0.1 /100 | #270 | Tragic $54,447 |
| Liberians | 0.1 /100 | #271 | Tragic $54,356 |
| Potawatomi | 0.1 /100 | #272 | Tragic $54,212 |
| Indonesians | 0.1 /100 | #273 | Tragic $54,176 |
| Barbadians | 0.1 /100 | #274 | Tragic $54,163 |
| Cherokee | 0.1 /100 | #275 | Tragic $54,133 |
| Cree | 0.1 /100 | #276 | Tragic $54,129 |
| Cheyenne | 0.1 /100 | #277 | Tragic $54,096 |
| Immigrants | Ecuador | 0.1 /100 | #278 | Tragic $54,030 |