Slovak vs Liberian Median Female Earnings
COMPARE
Slovak
Liberian
Median Female Earnings
Median Female Earnings Comparison
Slovaks
Liberians
$39,029
MEDIAN FEMALE EARNINGS
19.9/ 100
METRIC RATING
202nd/ 347
METRIC RANK
$38,215
MEDIAN FEMALE EARNINGS
4.4/ 100
METRIC RATING
236th/ 347
METRIC RANK
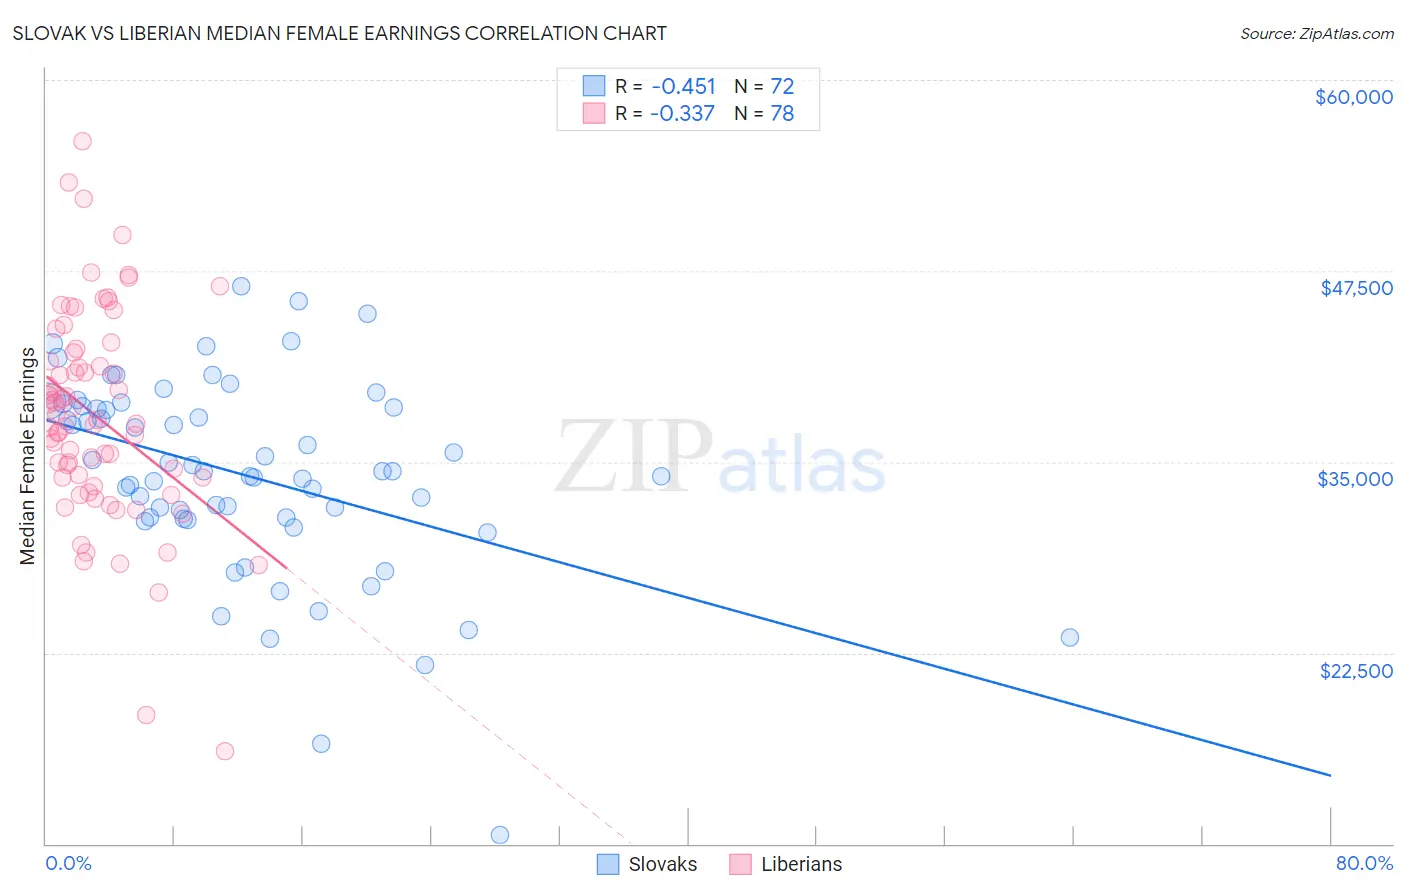
Slovak vs Liberian Median Female Earnings Correlation Chart
The statistical analysis conducted on geographies consisting of 397,593,925 people shows a moderate negative correlation between the proportion of Slovaks and median female earnings in the United States with a correlation coefficient (R) of -0.451 and weighted average of $39,029. Similarly, the statistical analysis conducted on geographies consisting of 118,095,616 people shows a mild negative correlation between the proportion of Liberians and median female earnings in the United States with a correlation coefficient (R) of -0.337 and weighted average of $38,215, a difference of 2.1%.
Median Female Earnings Correlation Summary
| Measurement | Slovak | Liberian |
| Minimum | $10,580 | $16,076 |
| Maximum | $46,470 | $56,012 |
| Range | $35,890 | $39,936 |
| Mean | $34,113 | $37,973 |
| Median | $34,365 | $37,624 |
| Interquartile 25% (IQ1) | $31,338 | $33,939 |
| Interquartile 75% (IQ3) | $38,606 | $42,173 |
| Interquartile Range (IQR) | $7,268 | $8,234 |
| Standard Deviation (Sample) | $6,495 | $6,991 |
| Standard Deviation (Population) | $6,450 | $6,946 |
Similar Demographics by Median Female Earnings
Demographics Similar to Slovaks by Median Female Earnings
In terms of median female earnings, the demographic groups most similar to Slovaks are Immigrants from Panama ($39,049, a difference of 0.050%), Panamanian ($39,049, a difference of 0.050%), Czech ($38,992, a difference of 0.090%), Icelander ($39,109, a difference of 0.21%), and Immigrants from Uruguay ($38,945, a difference of 0.22%).
| Demographics | Rating | Rank | Median Female Earnings |
| Uruguayans | 27.3 /100 | #195 | Fair $39,228 |
| Immigrants | Costa Rica | 25.6 /100 | #196 | Fair $39,186 |
| Assyrians/Chaldeans/Syriacs | 24.6 /100 | #197 | Fair $39,159 |
| Ecuadorians | 23.0 /100 | #198 | Fair $39,117 |
| Icelanders | 22.7 /100 | #199 | Fair $39,109 |
| Immigrants | Panama | 20.6 /100 | #200 | Fair $39,049 |
| Panamanians | 20.6 /100 | #201 | Fair $39,049 |
| Slovaks | 19.9 /100 | #202 | Poor $39,029 |
| Czechs | 18.7 /100 | #203 | Poor $38,992 |
| Immigrants | Uruguay | 17.3 /100 | #204 | Poor $38,945 |
| Immigrants | Colombia | 16.3 /100 | #205 | Poor $38,913 |
| Immigrants | Bosnia and Herzegovina | 15.6 /100 | #206 | Poor $38,886 |
| Immigrants | Cambodia | 14.2 /100 | #207 | Poor $38,833 |
| Immigrants | Thailand | 13.6 /100 | #208 | Poor $38,810 |
| Norwegians | 13.4 /100 | #209 | Poor $38,802 |
Demographics Similar to Liberians by Median Female Earnings
In terms of median female earnings, the demographic groups most similar to Liberians are Sudanese ($38,215, a difference of 0.0%), Immigrants from Cabo Verde ($38,208, a difference of 0.020%), Alaska Native ($38,202, a difference of 0.030%), English ($38,196, a difference of 0.050%), and Finnish ($38,173, a difference of 0.11%).
| Demographics | Rating | Rank | Median Female Earnings |
| Belgians | 6.1 /100 | #229 | Tragic $38,382 |
| Basques | 5.7 /100 | #230 | Tragic $38,352 |
| Somalis | 5.5 /100 | #231 | Tragic $38,333 |
| Scandinavians | 5.2 /100 | #232 | Tragic $38,306 |
| Tongans | 5.1 /100 | #233 | Tragic $38,288 |
| Celtics | 5.0 /100 | #234 | Tragic $38,283 |
| Sudanese | 4.4 /100 | #235 | Tragic $38,215 |
| Liberians | 4.4 /100 | #236 | Tragic $38,215 |
| Immigrants | Cabo Verde | 4.3 /100 | #237 | Tragic $38,208 |
| Alaska Natives | 4.3 /100 | #238 | Tragic $38,202 |
| English | 4.2 /100 | #239 | Tragic $38,196 |
| Finns | 4.0 /100 | #240 | Tragic $38,173 |
| Spanish | 3.5 /100 | #241 | Tragic $38,098 |
| Immigrants | Burma/Myanmar | 3.0 /100 | #242 | Tragic $38,028 |
| Germans | 2.8 /100 | #243 | Tragic $37,986 |