Spanish American Indian vs Liberian Divorced or Separated
COMPARE
Spanish American Indian
Liberian
Divorced or Separated
Divorced or Separated Comparison
Spanish American Indians
Liberians
11.6%
DIVORCED OR SEPARATED
99.0/ 100
METRIC RATING
91st/ 347
METRIC RANK
12.6%
DIVORCED OR SEPARATED
0.9/ 100
METRIC RATING
252nd/ 347
METRIC RANK
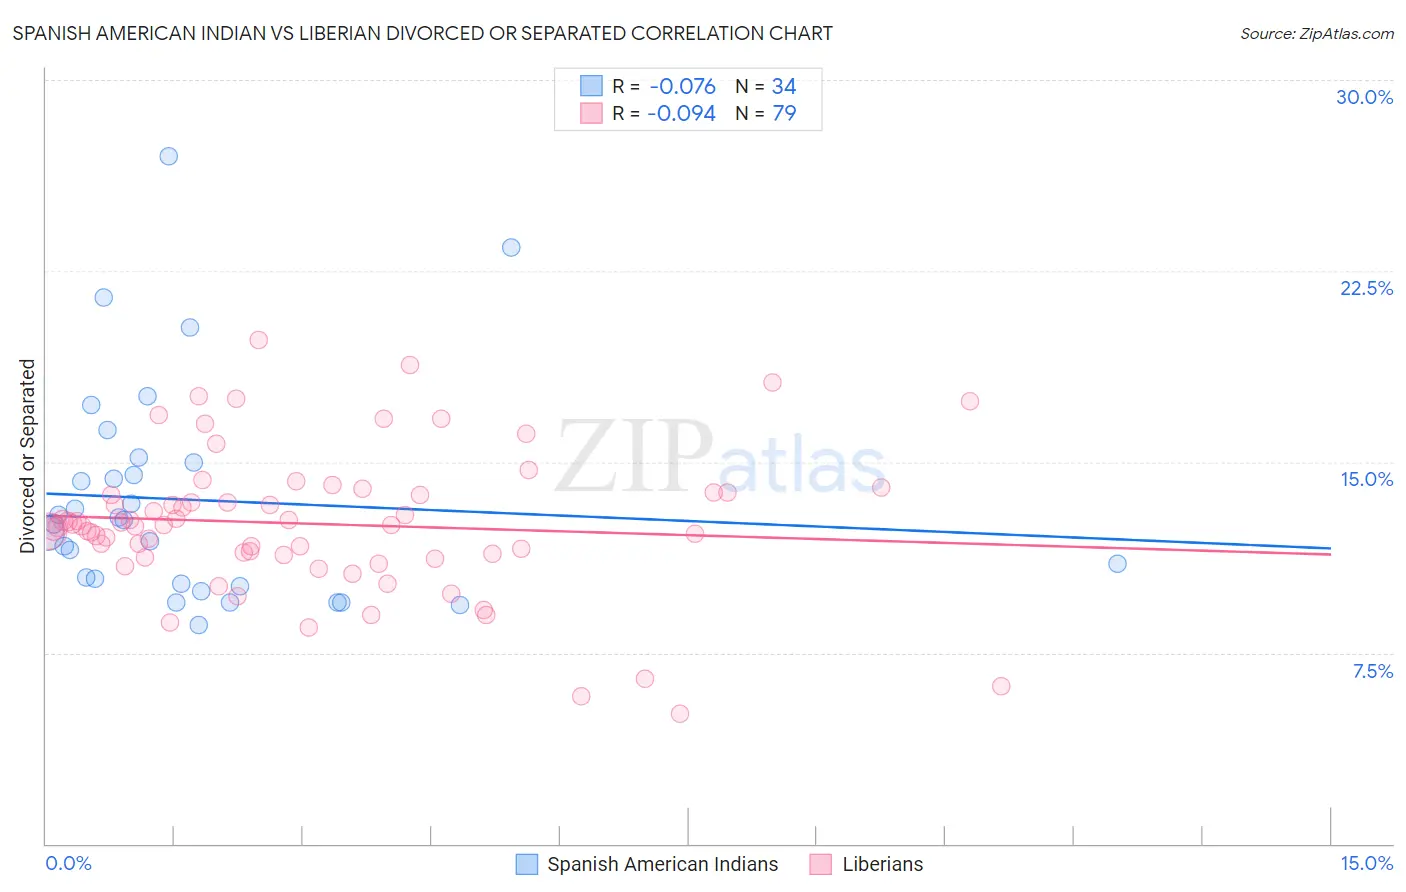
Spanish American Indian vs Liberian Divorced or Separated Correlation Chart
The statistical analysis conducted on geographies consisting of 73,145,304 people shows a slight negative correlation between the proportion of Spanish American Indians and percentage of population currently divorced or separated in the United States with a correlation coefficient (R) of -0.076 and weighted average of 11.6%. Similarly, the statistical analysis conducted on geographies consisting of 118,063,038 people shows a slight negative correlation between the proportion of Liberians and percentage of population currently divorced or separated in the United States with a correlation coefficient (R) of -0.094 and weighted average of 12.6%, a difference of 8.4%.
Divorced or Separated Correlation Summary
| Measurement | Spanish American Indian | Liberian |
| Minimum | 8.6% | 5.1% |
| Maximum | 27.0% | 19.8% |
| Range | 18.4% | 14.7% |
| Mean | 13.5% | 12.6% |
| Median | 12.6% | 12.5% |
| Interquartile 25% (IQ1) | 10.2% | 11.3% |
| Interquartile 75% (IQ3) | 15.0% | 13.8% |
| Interquartile Range (IQR) | 4.8% | 2.5% |
| Standard Deviation (Sample) | 4.3% | 2.8% |
| Standard Deviation (Population) | 4.3% | 2.8% |
Similar Demographics by Divorced or Separated
Demographics Similar to Spanish American Indians by Divorced or Separated
In terms of divorced or separated, the demographic groups most similar to Spanish American Indians are Zimbabwean (11.6%, a difference of 0.040%), Immigrants from Denmark (11.6%, a difference of 0.060%), Arab (11.6%, a difference of 0.060%), Immigrants from Fiji (11.6%, a difference of 0.070%), and Immigrants from Southern Europe (11.6%, a difference of 0.14%).
| Demographics | Rating | Rank | Divorced or Separated |
| Bulgarians | 99.3 /100 | #84 | Exceptional 11.5% |
| Immigrants | Albania | 99.3 /100 | #85 | Exceptional 11.5% |
| Immigrants | Latvia | 99.2 /100 | #86 | Exceptional 11.6% |
| Immigrants | Nepal | 99.2 /100 | #87 | Exceptional 11.6% |
| Immigrants | Europe | 99.2 /100 | #88 | Exceptional 11.6% |
| Immigrants | Southern Europe | 99.1 /100 | #89 | Exceptional 11.6% |
| Zimbabweans | 99.0 /100 | #90 | Exceptional 11.6% |
| Spanish American Indians | 99.0 /100 | #91 | Exceptional 11.6% |
| Immigrants | Denmark | 98.9 /100 | #92 | Exceptional 11.6% |
| Arabs | 98.9 /100 | #93 | Exceptional 11.6% |
| Immigrants | Fiji | 98.9 /100 | #94 | Exceptional 11.6% |
| Immigrants | Serbia | 98.8 /100 | #95 | Exceptional 11.6% |
| Immigrants | Ukraine | 98.7 /100 | #96 | Exceptional 11.6% |
| Latvians | 98.7 /100 | #97 | Exceptional 11.6% |
| Immigrants | Jordan | 98.6 /100 | #98 | Exceptional 11.6% |
Demographics Similar to Liberians by Divorced or Separated
In terms of divorced or separated, the demographic groups most similar to Liberians are Somali (12.6%, a difference of 0.0%), Senegalese (12.6%, a difference of 0.060%), Welsh (12.6%, a difference of 0.16%), Immigrants from Colombia (12.6%, a difference of 0.32%), and Irish (12.5%, a difference of 0.33%).
| Demographics | Rating | Rank | Divorced or Separated |
| Hispanics or Latinos | 2.0 /100 | #245 | Tragic 12.5% |
| Immigrants | West Indies | 1.9 /100 | #246 | Tragic 12.5% |
| Germans | 1.8 /100 | #247 | Tragic 12.5% |
| Nepalese | 1.8 /100 | #248 | Tragic 12.5% |
| Finns | 1.8 /100 | #249 | Tragic 12.5% |
| Irish | 1.3 /100 | #250 | Tragic 12.5% |
| Aleuts | 1.3 /100 | #251 | Tragic 12.5% |
| Liberians | 0.9 /100 | #252 | Tragic 12.6% |
| Somalis | 0.9 /100 | #253 | Tragic 12.6% |
| Senegalese | 0.8 /100 | #254 | Tragic 12.6% |
| Welsh | 0.7 /100 | #255 | Tragic 12.6% |
| Immigrants | Colombia | 0.6 /100 | #256 | Tragic 12.6% |
| Immigrants | Somalia | 0.6 /100 | #257 | Tragic 12.6% |
| Indonesians | 0.6 /100 | #258 | Tragic 12.6% |
| Yuman | 0.6 /100 | #259 | Tragic 12.6% |