Immigrants from Ghana vs Puget Sound Salish Householder Income Ages 45 - 64 years
COMPARE
Immigrants from Ghana
Puget Sound Salish
Householder Income Ages 45 - 64 years
Householder Income Ages 45 - 64 years Comparison
Immigrants from Ghana
Puget Sound Salish
$94,982
HOUSEHOLDER INCOME AGES 45 - 64 YEARS
6.4/ 100
METRIC RATING
217th/ 347
METRIC RANK
$98,340
HOUSEHOLDER INCOME AGES 45 - 64 YEARS
27.0/ 100
METRIC RATING
197th/ 347
METRIC RANK
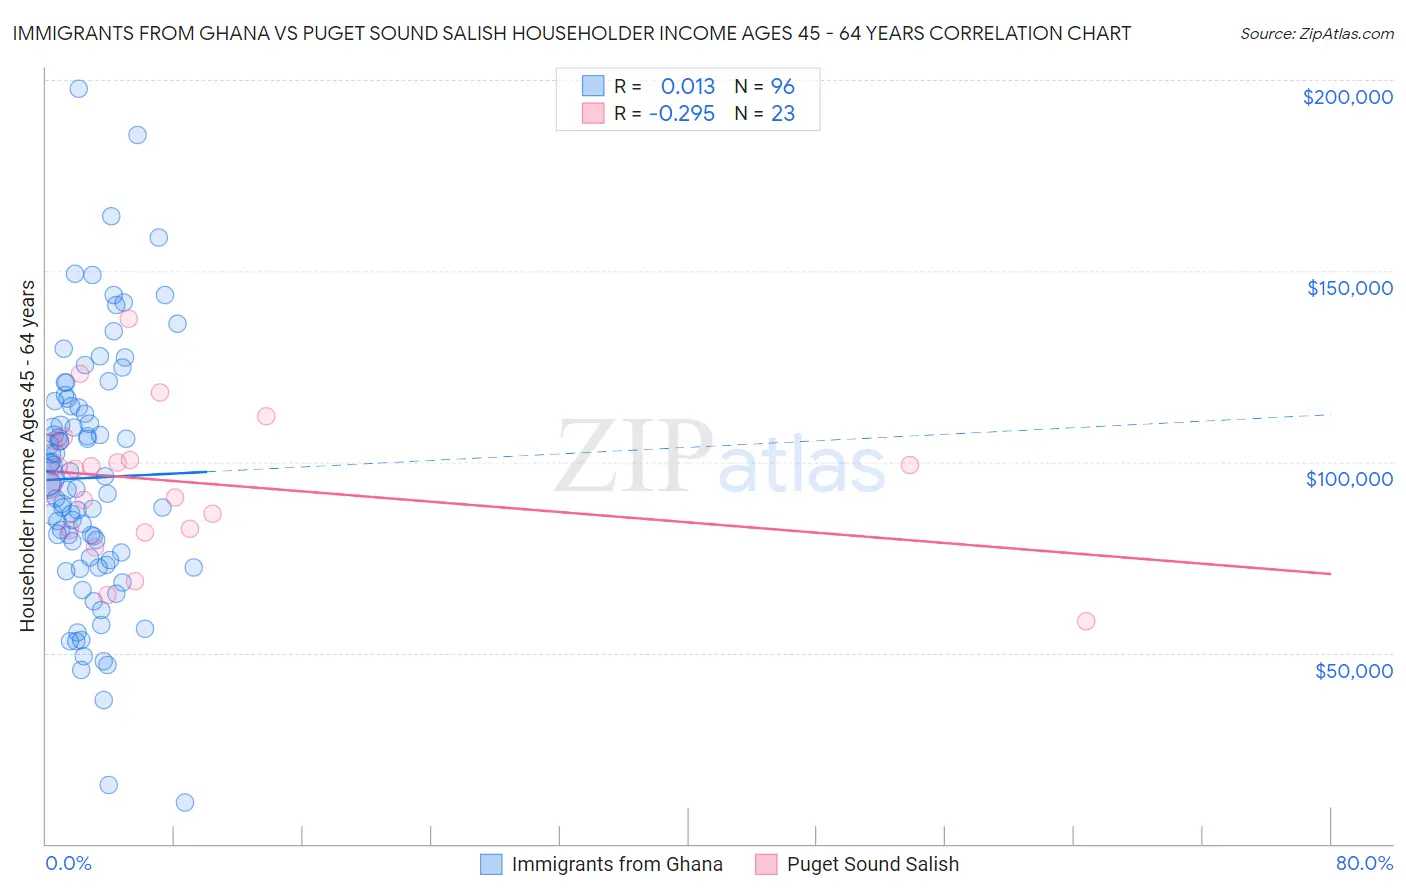
Immigrants from Ghana vs Puget Sound Salish Householder Income Ages 45 - 64 years Correlation Chart
The statistical analysis conducted on geographies consisting of 199,704,082 people shows no correlation between the proportion of Immigrants from Ghana and household income with householder between the ages 45 and 64 in the United States with a correlation coefficient (R) of 0.013 and weighted average of $94,982. Similarly, the statistical analysis conducted on geographies consisting of 46,126,240 people shows a weak negative correlation between the proportion of Puget Sound Salish and household income with householder between the ages 45 and 64 in the United States with a correlation coefficient (R) of -0.295 and weighted average of $98,340, a difference of 3.5%.
Householder Income Ages 45 - 64 years Correlation Summary
| Measurement | Immigrants from Ghana | Puget Sound Salish |
| Minimum | $10,938 | $58,333 |
| Maximum | $197,851 | $137,604 |
| Range | $186,913 | $79,271 |
| Mean | $95,814 | $94,554 |
| Median | $94,054 | $98,357 |
| Interquartile 25% (IQ1) | $74,592 | $82,172 |
| Interquartile 75% (IQ3) | $114,445 | $105,339 |
| Interquartile Range (IQR) | $39,852 | $23,167 |
| Standard Deviation (Sample) | $33,020 | $18,602 |
| Standard Deviation (Population) | $32,848 | $18,193 |
Demographics Similar to Immigrants from Ghana and Puget Sound Salish by Householder Income Ages 45 - 64 years
In terms of householder income ages 45 - 64 years, the demographic groups most similar to Immigrants from Ghana are Immigrants from Venezuela ($95,342, a difference of 0.38%), Nigerian ($95,492, a difference of 0.54%), Panamanian ($96,066, a difference of 1.1%), Immigrants from Uruguay ($96,086, a difference of 1.2%), and Venezuelan ($96,460, a difference of 1.6%). Similarly, the demographic groups most similar to Puget Sound Salish are Immigrants from Iraq ($98,201, a difference of 0.14%), White/Caucasian ($98,091, a difference of 0.25%), Immigrants from Kenya ($97,964, a difference of 0.38%), Yugoslavian ($97,558, a difference of 0.80%), and Tlingit-Haida ($97,417, a difference of 0.95%).
| Demographics | Rating | Rank | Householder Income Ages 45 - 64 years |
| Puget Sound Salish | 27.0 /100 | #197 | Fair $98,340 |
| Immigrants | Iraq | 25.7 /100 | #198 | Fair $98,201 |
| Whites/Caucasians | 24.6 /100 | #199 | Fair $98,091 |
| Immigrants | Kenya | 23.5 /100 | #200 | Fair $97,964 |
| Yugoslavians | 20.0 /100 | #201 | Fair $97,558 |
| Tlingit-Haida | 18.9 /100 | #202 | Poor $97,417 |
| Immigrants | Thailand | 18.8 /100 | #203 | Poor $97,400 |
| Immigrants | Eritrea | 18.6 /100 | #204 | Poor $97,373 |
| Immigrants | Colombia | 18.0 /100 | #205 | Poor $97,290 |
| Immigrants | Africa | 17.9 /100 | #206 | Poor $97,284 |
| Ghanaians | 17.9 /100 | #207 | Poor $97,277 |
| Scotch-Irish | 16.4 /100 | #208 | Poor $97,073 |
| Japanese | 14.8 /100 | #209 | Poor $96,834 |
| Tsimshian | 14.5 /100 | #210 | Poor $96,783 |
| Immigrants | Cambodia | 13.0 /100 | #211 | Poor $96,537 |
| Venezuelans | 12.6 /100 | #212 | Poor $96,460 |
| Immigrants | Uruguay | 10.7 /100 | #213 | Poor $96,086 |
| Panamanians | 10.6 /100 | #214 | Poor $96,066 |
| Nigerians | 8.2 /100 | #215 | Tragic $95,492 |
| Immigrants | Venezuela | 7.6 /100 | #216 | Tragic $95,342 |
| Immigrants | Ghana | 6.4 /100 | #217 | Tragic $94,982 |