South American vs Immigrants from South Eastern Asia Median Female Earnings
COMPARE
South American
Immigrants from South Eastern Asia
Median Female Earnings
Median Female Earnings Comparison
South Americans
Immigrants from South Eastern Asia
$39,698
MEDIAN FEMALE EARNINGS
50.0/ 100
METRIC RATING
174th/ 347
METRIC RANK
$40,558
MEDIAN FEMALE EARNINGS
85.7/ 100
METRIC RATING
139th/ 347
METRIC RANK
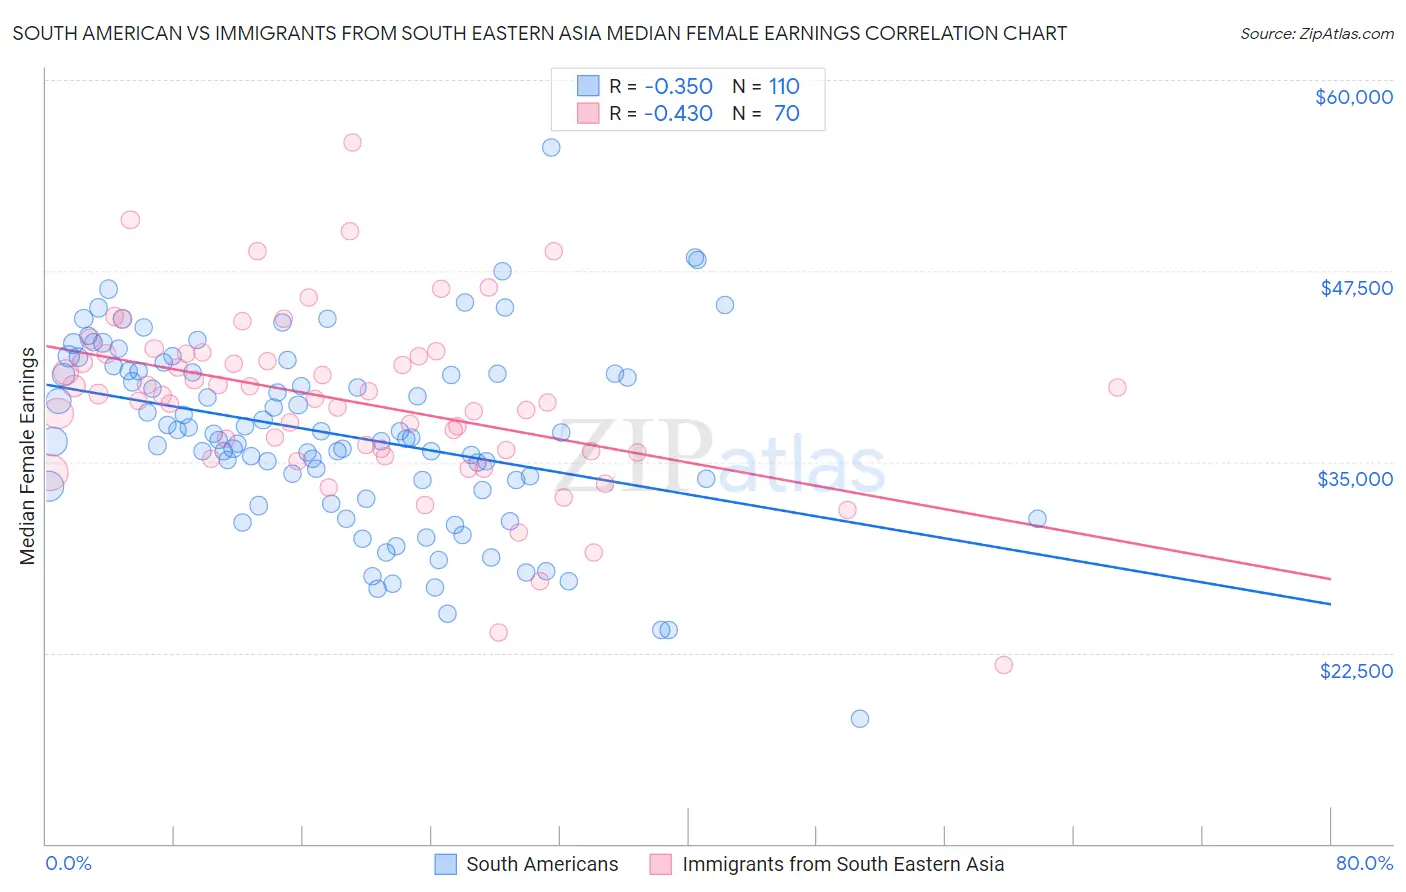
South American vs Immigrants from South Eastern Asia Median Female Earnings Correlation Chart
The statistical analysis conducted on geographies consisting of 493,793,554 people shows a mild negative correlation between the proportion of South Americans and median female earnings in the United States with a correlation coefficient (R) of -0.350 and weighted average of $39,698. Similarly, the statistical analysis conducted on geographies consisting of 512,224,211 people shows a moderate negative correlation between the proportion of Immigrants from South Eastern Asia and median female earnings in the United States with a correlation coefficient (R) of -0.430 and weighted average of $40,558, a difference of 2.2%.
Median Female Earnings Correlation Summary
| Measurement | South American | Immigrants from South Eastern Asia |
| Minimum | $18,150 | $21,667 |
| Maximum | $55,607 | $55,907 |
| Range | $37,457 | $34,240 |
| Mean | $36,804 | $38,991 |
| Median | $36,715 | $39,248 |
| Interquartile 25% (IQ1) | $33,376 | $35,697 |
| Interquartile 75% (IQ3) | $40,920 | $42,089 |
| Interquartile Range (IQR) | $7,545 | $6,392 |
| Standard Deviation (Sample) | $6,134 | $5,838 |
| Standard Deviation (Population) | $6,106 | $5,797 |
Similar Demographics by Median Female Earnings
Demographics Similar to South Americans by Median Female Earnings
In terms of median female earnings, the demographic groups most similar to South Americans are Canadian ($39,724, a difference of 0.070%), Immigrants from South America ($39,643, a difference of 0.14%), Nigerian ($39,641, a difference of 0.14%), British ($39,772, a difference of 0.19%), and Costa Rican ($39,622, a difference of 0.19%).
| Demographics | Rating | Rank | Median Female Earnings |
| Luxembourgers | 59.9 /100 | #167 | Average $39,891 |
| Immigrants | Peru | 58.9 /100 | #168 | Average $39,871 |
| Kenyans | 58.4 /100 | #169 | Average $39,860 |
| Slovenes | 56.2 /100 | #170 | Average $39,817 |
| Immigrants | Portugal | 54.7 /100 | #171 | Average $39,788 |
| British | 53.8 /100 | #172 | Average $39,772 |
| Canadians | 51.4 /100 | #173 | Average $39,724 |
| South Americans | 50.0 /100 | #174 | Average $39,698 |
| Immigrants | South America | 47.2 /100 | #175 | Average $39,643 |
| Nigerians | 47.0 /100 | #176 | Average $39,641 |
| Costa Ricans | 46.1 /100 | #177 | Average $39,622 |
| Slavs | 45.6 /100 | #178 | Average $39,613 |
| Immigrants | Germany | 45.1 /100 | #179 | Average $39,603 |
| Immigrants | Kenya | 41.6 /100 | #180 | Average $39,535 |
| Tsimshian | 41.4 /100 | #181 | Average $39,530 |
Demographics Similar to Immigrants from South Eastern Asia by Median Female Earnings
In terms of median female earnings, the demographic groups most similar to Immigrants from South Eastern Asia are Taiwanese ($40,576, a difference of 0.040%), Serbian ($40,539, a difference of 0.050%), Pakistani ($40,596, a difference of 0.090%), Immigrants from Syria ($40,499, a difference of 0.15%), and Sri Lankan ($40,496, a difference of 0.15%).
| Demographics | Rating | Rank | Median Female Earnings |
| Immigrants | Uganda | 89.7 /100 | #132 | Excellent $40,739 |
| Syrians | 89.5 /100 | #133 | Excellent $40,727 |
| Arabs | 89.3 /100 | #134 | Excellent $40,718 |
| Immigrants | Nepal | 89.0 /100 | #135 | Excellent $40,704 |
| Immigrants | Eastern Africa | 87.7 /100 | #136 | Excellent $40,644 |
| Pakistanis | 86.6 /100 | #137 | Excellent $40,596 |
| Taiwanese | 86.1 /100 | #138 | Excellent $40,576 |
| Immigrants | South Eastern Asia | 85.7 /100 | #139 | Excellent $40,558 |
| Serbians | 85.2 /100 | #140 | Excellent $40,539 |
| Immigrants | Syria | 84.1 /100 | #141 | Excellent $40,499 |
| Sri Lankans | 84.0 /100 | #142 | Excellent $40,496 |
| Northern Europeans | 83.9 /100 | #143 | Excellent $40,491 |
| Immigrants | North Macedonia | 83.8 /100 | #144 | Excellent $40,488 |
| Brazilians | 83.6 /100 | #145 | Excellent $40,483 |
| Ghanaians | 82.1 /100 | #146 | Excellent $40,429 |