Somali vs Immigrants from Western Europe Per Capita Income
COMPARE
Somali
Immigrants from Western Europe
Per Capita Income
Per Capita Income Comparison
Somalis
Immigrants from Western Europe
$40,367
PER CAPITA INCOME
2.4/ 100
METRIC RATING
238th/ 347
METRIC RANK
$50,065
PER CAPITA INCOME
99.9/ 100
METRIC RATING
55th/ 347
METRIC RANK
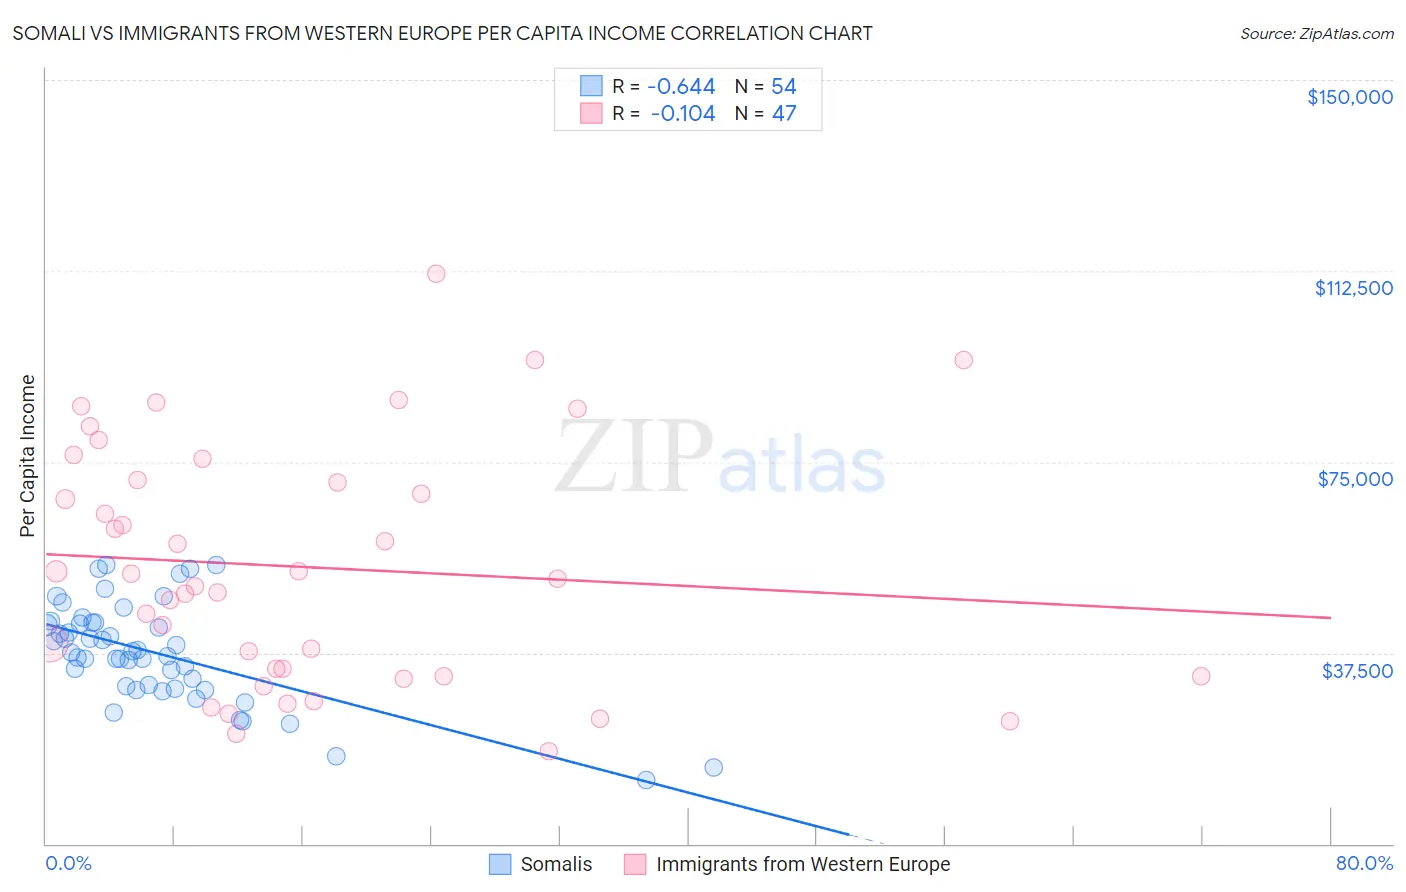
Somali vs Immigrants from Western Europe Per Capita Income Correlation Chart
The statistical analysis conducted on geographies consisting of 99,334,522 people shows a significant negative correlation between the proportion of Somalis and per capita income in the United States with a correlation coefficient (R) of -0.644 and weighted average of $40,367. Similarly, the statistical analysis conducted on geographies consisting of 494,094,837 people shows a poor negative correlation between the proportion of Immigrants from Western Europe and per capita income in the United States with a correlation coefficient (R) of -0.104 and weighted average of $50,065, a difference of 24.0%.
Per Capita Income Correlation Summary
| Measurement | Somali | Immigrants from Western Europe |
| Minimum | $12,576 | $18,269 |
| Maximum | $54,740 | $111,976 |
| Range | $42,164 | $93,707 |
| Mean | $37,481 | $54,316 |
| Median | $37,654 | $51,952 |
| Interquartile 25% (IQ1) | $31,050 | $33,002 |
| Interquartile 75% (IQ3) | $43,455 | $71,320 |
| Interquartile Range (IQR) | $12,404 | $38,319 |
| Standard Deviation (Sample) | $9,737 | $23,455 |
| Standard Deviation (Population) | $9,647 | $23,204 |
Similar Demographics by Per Capita Income
Demographics Similar to Somalis by Per Capita Income
In terms of per capita income, the demographic groups most similar to Somalis are Tsimshian ($40,344, a difference of 0.060%), Immigrants from Nigeria ($40,339, a difference of 0.070%), British West Indian ($40,330, a difference of 0.090%), Immigrants from Cambodia ($40,434, a difference of 0.16%), and Immigrants from Western Africa ($40,294, a difference of 0.18%).
| Demographics | Rating | Rank | Per Capita Income |
| Senegalese | 4.8 /100 | #231 | Tragic $41,000 |
| Guyanese | 4.5 /100 | #232 | Tragic $40,949 |
| Delaware | 3.8 /100 | #233 | Tragic $40,778 |
| Immigrants | West Indies | 3.7 /100 | #234 | Tragic $40,763 |
| Immigrants | Guyana | 3.6 /100 | #235 | Tragic $40,742 |
| Immigrants | Nonimmigrants | 3.4 /100 | #236 | Tragic $40,669 |
| Immigrants | Cambodia | 2.6 /100 | #237 | Tragic $40,434 |
| Somalis | 2.4 /100 | #238 | Tragic $40,367 |
| Tsimshian | 2.4 /100 | #239 | Tragic $40,344 |
| Immigrants | Nigeria | 2.3 /100 | #240 | Tragic $40,339 |
| British West Indians | 2.3 /100 | #241 | Tragic $40,330 |
| Immigrants | Western Africa | 2.2 /100 | #242 | Tragic $40,294 |
| German Russians | 2.2 /100 | #243 | Tragic $40,266 |
| French American Indians | 2.1 /100 | #244 | Tragic $40,244 |
| Sub-Saharan Africans | 1.9 /100 | #245 | Tragic $40,152 |
Demographics Similar to Immigrants from Western Europe by Per Capita Income
In terms of per capita income, the demographic groups most similar to Immigrants from Western Europe are Asian ($50,057, a difference of 0.020%), South African ($50,044, a difference of 0.040%), Immigrants from Malaysia ($49,983, a difference of 0.16%), Bhutanese ($49,894, a difference of 0.34%), and Immigrants from Scotland ($49,893, a difference of 0.34%).
| Demographics | Rating | Rank | Per Capita Income |
| Immigrants | Serbia | 100.0 /100 | #48 | Exceptional $50,810 |
| New Zealanders | 100.0 /100 | #49 | Exceptional $50,575 |
| Immigrants | Sri Lanka | 100.0 /100 | #50 | Exceptional $50,555 |
| Immigrants | Netherlands | 100.0 /100 | #51 | Exceptional $50,458 |
| Immigrants | Croatia | 99.9 /100 | #52 | Exceptional $50,417 |
| Paraguayans | 99.9 /100 | #53 | Exceptional $50,385 |
| Immigrants | Belarus | 99.9 /100 | #54 | Exceptional $50,303 |
| Immigrants | Western Europe | 99.9 /100 | #55 | Exceptional $50,065 |
| Asians | 99.9 /100 | #56 | Exceptional $50,057 |
| South Africans | 99.9 /100 | #57 | Exceptional $50,044 |
| Immigrants | Malaysia | 99.9 /100 | #58 | Exceptional $49,983 |
| Bhutanese | 99.9 /100 | #59 | Exceptional $49,894 |
| Immigrants | Scotland | 99.9 /100 | #60 | Exceptional $49,893 |
| Argentineans | 99.9 /100 | #61 | Exceptional $49,862 |
| Immigrants | Asia | 99.9 /100 | #62 | Exceptional $49,741 |