Slovene vs Immigrants from Romania Householder Income Ages 25 - 44 years
COMPARE
Slovene
Immigrants from Romania
Householder Income Ages 25 - 44 years
Householder Income Ages 25 - 44 years Comparison
Slovenes
Immigrants from Romania
$96,439
HOUSEHOLDER INCOME AGES 25 - 44 YEARS
73.9/ 100
METRIC RATING
153rd/ 347
METRIC RANK
$104,713
HOUSEHOLDER INCOME AGES 25 - 44 YEARS
99.6/ 100
METRIC RATING
67th/ 347
METRIC RANK
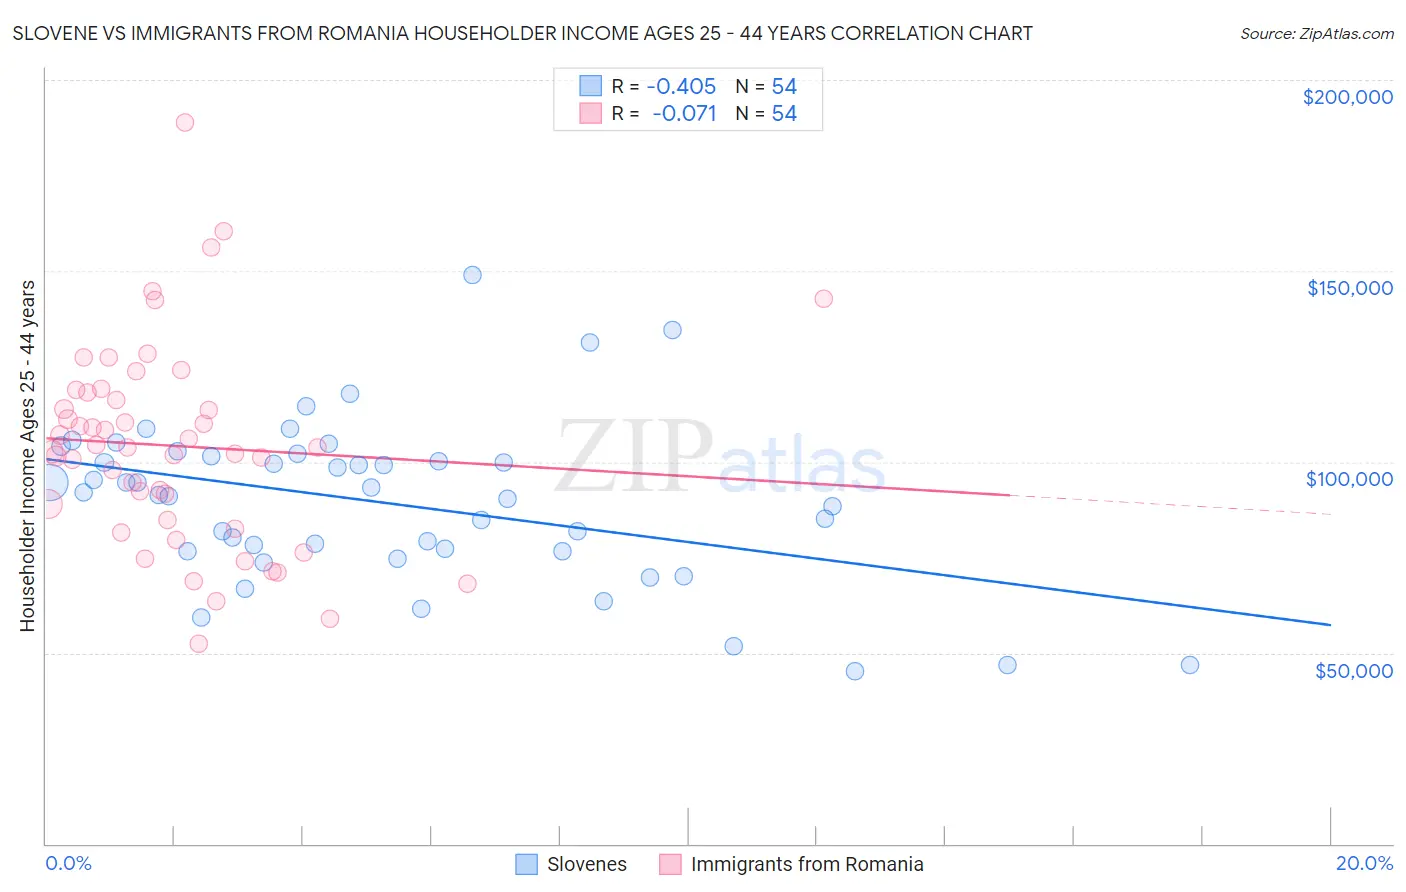
Slovene vs Immigrants from Romania Householder Income Ages 25 - 44 years Correlation Chart
The statistical analysis conducted on geographies consisting of 260,772,940 people shows a moderate negative correlation between the proportion of Slovenes and household income with householder between the ages 25 and 44 in the United States with a correlation coefficient (R) of -0.405 and weighted average of $96,439. Similarly, the statistical analysis conducted on geographies consisting of 256,633,745 people shows a slight negative correlation between the proportion of Immigrants from Romania and household income with householder between the ages 25 and 44 in the United States with a correlation coefficient (R) of -0.071 and weighted average of $104,713, a difference of 8.6%.
Householder Income Ages 25 - 44 years Correlation Summary
| Measurement | Slovene | Immigrants from Romania |
| Minimum | $45,114 | $52,260 |
| Maximum | $149,005 | $188,943 |
| Range | $103,891 | $136,683 |
| Mean | $89,263 | $104,157 |
| Median | $91,712 | $103,726 |
| Interquartile 25% (IQ1) | $76,661 | $84,716 |
| Interquartile 75% (IQ3) | $101,430 | $118,244 |
| Interquartile Range (IQR) | $24,769 | $33,528 |
| Standard Deviation (Sample) | $21,285 | $26,678 |
| Standard Deviation (Population) | $21,087 | $26,430 |
Similar Demographics by Householder Income Ages 25 - 44 years
Demographics Similar to Slovenes by Householder Income Ages 25 - 44 years
In terms of householder income ages 25 - 44 years, the demographic groups most similar to Slovenes are South American Indian ($96,497, a difference of 0.060%), Slavic ($96,377, a difference of 0.060%), Czech ($96,525, a difference of 0.090%), Ugandan ($96,667, a difference of 0.24%), and Basque ($96,709, a difference of 0.28%).
| Demographics | Rating | Rank | Householder Income Ages 25 - 44 years |
| Ethiopians | 77.8 /100 | #146 | Good $96,824 |
| Immigrants | Syria | 77.4 /100 | #147 | Good $96,789 |
| Irish | 76.9 /100 | #148 | Good $96,730 |
| Basques | 76.6 /100 | #149 | Good $96,709 |
| Ugandans | 76.2 /100 | #150 | Good $96,667 |
| Czechs | 74.8 /100 | #151 | Good $96,525 |
| South American Indians | 74.5 /100 | #152 | Good $96,497 |
| Slovenes | 73.9 /100 | #153 | Good $96,439 |
| Slavs | 73.2 /100 | #154 | Good $96,377 |
| Moroccans | 70.3 /100 | #155 | Good $96,117 |
| Immigrants | Germany | 67.9 /100 | #156 | Good $95,913 |
| Immigrants | Uganda | 65.2 /100 | #157 | Good $95,698 |
| Scandinavians | 63.9 /100 | #158 | Good $95,596 |
| Costa Ricans | 63.5 /100 | #159 | Good $95,565 |
| Icelanders | 63.4 /100 | #160 | Good $95,560 |
Demographics Similar to Immigrants from Romania by Householder Income Ages 25 - 44 years
In terms of householder income ages 25 - 44 years, the demographic groups most similar to Immigrants from Romania are Immigrants from Eastern Europe ($104,662, a difference of 0.050%), Mongolian ($104,578, a difference of 0.13%), Immigrants from Croatia ($104,503, a difference of 0.20%), Laotian ($104,993, a difference of 0.27%), and Afghan ($104,410, a difference of 0.29%).
| Demographics | Rating | Rank | Householder Income Ages 25 - 44 years |
| Egyptians | 99.7 /100 | #60 | Exceptional $105,282 |
| Lithuanians | 99.7 /100 | #61 | Exceptional $105,223 |
| Immigrants | Italy | 99.7 /100 | #62 | Exceptional $105,201 |
| Immigrants | Scotland | 99.7 /100 | #63 | Exceptional $105,089 |
| New Zealanders | 99.7 /100 | #64 | Exceptional $105,085 |
| Immigrants | Netherlands | 99.7 /100 | #65 | Exceptional $105,082 |
| Laotians | 99.7 /100 | #66 | Exceptional $104,993 |
| Immigrants | Romania | 99.6 /100 | #67 | Exceptional $104,713 |
| Immigrants | Eastern Europe | 99.6 /100 | #68 | Exceptional $104,662 |
| Mongolians | 99.6 /100 | #69 | Exceptional $104,578 |
| Immigrants | Croatia | 99.6 /100 | #70 | Exceptional $104,503 |
| Afghans | 99.6 /100 | #71 | Exceptional $104,410 |
| Chinese | 99.5 /100 | #72 | Exceptional $104,264 |
| Italians | 99.5 /100 | #73 | Exceptional $104,215 |
| Immigrants | Fiji | 99.5 /100 | #74 | Exceptional $103,954 |