Slovene vs Inupiat Householder Income Over 65 years
COMPARE
Slovene
Inupiat
Householder Income Over 65 years
Householder Income Over 65 years Comparison
Slovenes
Inupiat
$60,241
HOUSEHOLDER INCOME OVER 65 YEARS
31.8/ 100
METRIC RATING
186th/ 347
METRIC RANK
$61,061
HOUSEHOLDER INCOME OVER 65 YEARS
52.4/ 100
METRIC RATING
171st/ 347
METRIC RANK
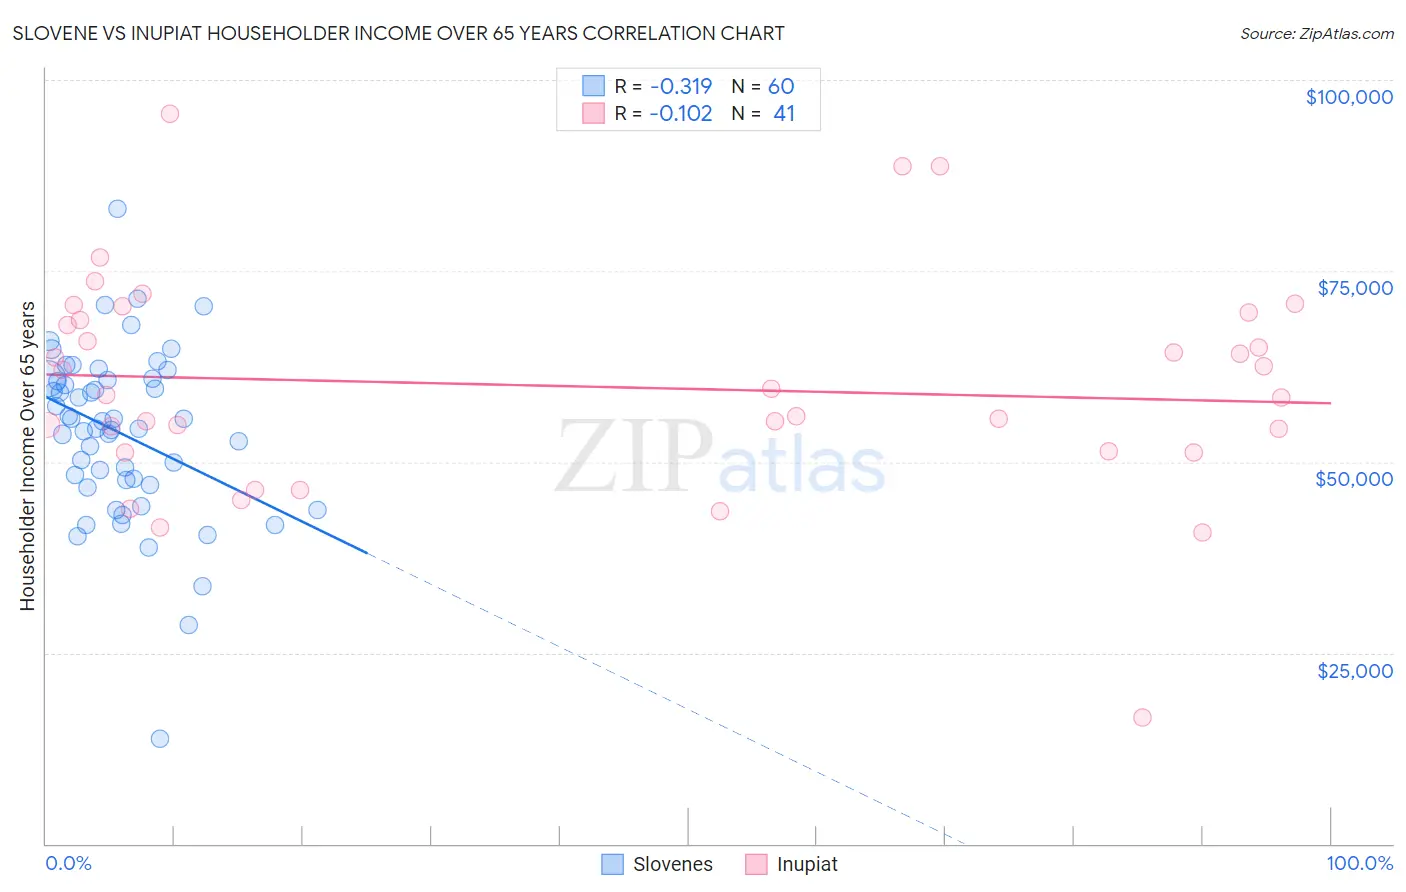
Slovene vs Inupiat Householder Income Over 65 years Correlation Chart
The statistical analysis conducted on geographies consisting of 260,915,590 people shows a mild negative correlation between the proportion of Slovenes and household income with householder over the age of 65 in the United States with a correlation coefficient (R) of -0.319 and weighted average of $60,241. Similarly, the statistical analysis conducted on geographies consisting of 96,206,206 people shows a poor negative correlation between the proportion of Inupiat and household income with householder over the age of 65 in the United States with a correlation coefficient (R) of -0.102 and weighted average of $61,061, a difference of 1.4%.
Householder Income Over 65 years Correlation Summary
| Measurement | Slovene | Inupiat |
| Minimum | $13,750 | $16,607 |
| Maximum | $83,108 | $95,647 |
| Range | $69,358 | $79,040 |
| Mean | $53,745 | $59,905 |
| Median | $54,879 | $58,687 |
| Interquartile 25% (IQ1) | $47,317 | $51,307 |
| Interquartile 75% (IQ3) | $60,731 | $69,101 |
| Interquartile Range (IQR) | $13,414 | $17,794 |
| Standard Deviation (Sample) | $11,247 | $14,461 |
| Standard Deviation (Population) | $11,153 | $14,284 |
Demographics Similar to Slovenes and Inupiat by Householder Income Over 65 years
In terms of householder income over 65 years, the demographic groups most similar to Slovenes are Albanian ($60,249, a difference of 0.010%), Immigrants from Thailand ($60,217, a difference of 0.040%), Immigrants from Eritrea ($60,096, a difference of 0.24%), Iraqi ($60,466, a difference of 0.37%), and Kenyan ($60,514, a difference of 0.45%). Similarly, the demographic groups most similar to Inupiat are Immigrants from Poland ($61,041, a difference of 0.030%), Serbian ($61,087, a difference of 0.040%), Carpatho Rusyn ($61,093, a difference of 0.050%), Irish ($61,097, a difference of 0.060%), and Immigrants from Micronesia ($61,000, a difference of 0.10%).
| Demographics | Rating | Rank | Householder Income Over 65 years |
| Irish | 53.4 /100 | #168 | Average $61,097 |
| Carpatho Rusyns | 53.3 /100 | #169 | Average $61,093 |
| Serbians | 53.1 /100 | #170 | Average $61,087 |
| Inupiat | 52.4 /100 | #171 | Average $61,061 |
| Immigrants | Poland | 51.9 /100 | #172 | Average $61,041 |
| Immigrants | Micronesia | 50.8 /100 | #173 | Average $61,000 |
| Luxembourgers | 50.0 /100 | #174 | Average $60,967 |
| Spaniards | 47.3 /100 | #175 | Average $60,866 |
| Spanish | 45.5 /100 | #176 | Average $60,795 |
| Alaska Natives | 44.3 /100 | #177 | Average $60,748 |
| Yup'ik | 43.7 /100 | #178 | Average $60,727 |
| Welsh | 42.2 /100 | #179 | Average $60,666 |
| Immigrants | Morocco | 41.7 /100 | #180 | Average $60,647 |
| Celtics | 40.7 /100 | #181 | Average $60,608 |
| Czechoslovakians | 40.0 /100 | #182 | Average $60,581 |
| Kenyans | 38.4 /100 | #183 | Fair $60,514 |
| Iraqis | 37.2 /100 | #184 | Fair $60,466 |
| Albanians | 32.0 /100 | #185 | Fair $60,249 |
| Slovenes | 31.8 /100 | #186 | Fair $60,241 |
| Immigrants | Thailand | 31.3 /100 | #187 | Fair $60,217 |
| Immigrants | Eritrea | 28.6 /100 | #188 | Fair $60,096 |