Slovene vs Immigrants from Fiji Householder Income Over 65 years

COMPARE

Slovene
Race
Ancestry
AfghanAfricanAlaska NativeAlaskan AthabascanAlbanianAleutAlsatianAmericanApacheArabArapahoArgentineanArmenianAssyrian/Chaldean/SyriacAustralianAustrianBahamianBangladeshiBarbadianBasqueBelgianBelizeanBermudanBhutaneseBlackfeetBolivianBrazilianBritishBritish West IndianBulgarianBurmeseCajunCambodianCanadianCape VerdeanCarpatho RusynCelticCentral AmericanCentral American IndianCherokeeCheyenneChickasawChileanChineseChippewaChoctawColombianColvilleComancheCosta RicanCreeCreekCroatianCrowCubanCypriotCzechCzechoslovakianDanishDelawareDominicanDutchDutch West IndianEastern EuropeanEcuadorianEgyptianEnglishEstonianEthiopianEuropeanFijianFilipinoFinnishFrenchFrench American IndianFrench CanadianGermanGerman RussianGhanaianGreekGuamanian/ChamorroGuatemalanGuyaneseHaitianHmongHonduranHopiHoumaHungarianIcelanderIndian (Asian)IndonesianInupiatIranianIraqiIrishIroquoisIsraeliItalianJamaicanJapaneseJordanianKenyanKiowaKoreanLaotianLatvianLebaneseLiberianLithuanianLumbeeLuxembourgerMacedonianMalaysianMalteseMarshalleseMenomineeMexicanMexican American IndianMongolianMoroccanNative HawaiianNavajoNepaleseNew ZealanderNicaraguanNigerianNorthern EuropeanNorwegianOkinawanOsageOttawaPaiutePakistaniPalestinianPanamanianParaguayanPennsylvania GermanPeruvianPimaPolishPortuguesePotawatomiPuebloPuerto RicanPuget Sound SalishRomanianRussianSalvadoranSamoanScandinavianScotch-IrishScottishSeminoleSenegaleseSerbianShoshoneSierra LeoneanSiouxSlavicSlovakSloveneSomaliSouth AfricanSouth AmericanSouth American IndianSoviet UnionSpaniardSpanishSpanish AmericanSpanish American IndianSri LankanSubsaharan AfricanSudaneseSwedishSwissSyrianTaiwaneseThaiTlingit-HaidaTohono O'OdhamTonganTrinidadian and TobagonianTsimshianTurkishU.S. Virgin IslanderUgandanUkrainianUruguayanUteVenezuelanVietnameseWelshWest IndianYakamaYaquiYugoslavianYumanYup'ikZimbabwean
Immigration
NonimmigrantsImmigrantsAfghanistanAfricaAlbaniaArgentinaArmeniaAsiaAustraliaAustriaBahamasBangladeshBarbadosBelarusBelgiumBelizeBoliviaBosnia and HerzegovinaBrazilBulgariaBurma/MyanmarCabo VerdeCambodiaCameroonCanadaCaribbeanCentral AmericaChileChinaColombiaCongoCosta RicaCroatiaCubaCzechoslovakiaDenmarkDominicaDominican RepublicEastern AfricaEastern AsiaEastern EuropeEcuadorEgyptEl SalvadorEnglandEritreaEthiopiaEuropeFranceGermanyGhanaGreeceGrenadaGuatemalaGuyanaHaitiHondurasHong KongHungaryIndiaIndonesiaIranIraqIrelandIsraelItalyJamaicaJapanJordanKazakhstanKenyaKoreaKuwaitLaosLatin AmericaLatviaLebanonLiberiaLithuaniaMalaysiaMexicoMicronesiaMiddle AfricaMoldovaMoroccoNepalNetherlandsNicaraguaNigeriaNorth AmericaNorth MacedoniaNorthern AfricaNorthern EuropeNorwayOceaniaPakistanPanamaPeruPhilippinesPolandPortugalRomaniaRussiaSaudi ArabiaScotlandSenegalSerbiaSierra LeoneSingaporeSomaliaSouth AfricaSouth AmericaSouth Central AsiaSouth Eastern AsiaSouthern EuropeSpainSri LankaSt. Vincent and the GrenadinesSudanSwedenSwitzerlandSyriaTaiwanThailandTrinidad and TobagoTurkeyUgandaUkraineUruguayUzbekistanVenezuelaVietnamWest IndiesWestern AfricaWestern AsiaWestern EuropeYemenZaireZimbabweAzores
Immigrants from Fiji
Race
Ancestry
AfghanAfricanAlaska NativeAlaskan AthabascanAlbanianAleutAlsatianAmericanApacheArabArapahoArgentineanArmenianAssyrian/Chaldean/SyriacAustralianAustrianBahamianBangladeshiBarbadianBasqueBelgianBelizeanBermudanBhutaneseBlackfeetBolivianBrazilianBritishBritish West IndianBulgarianBurmeseCajunCambodianCanadianCape VerdeanCarpatho RusynCelticCentral AmericanCentral American IndianCherokeeCheyenneChickasawChileanChineseChippewaChoctawColombianColvilleComancheCosta RicanCreeCreekCroatianCrowCubanCypriotCzechCzechoslovakianDanishDelawareDominicanDutchDutch West IndianEastern EuropeanEcuadorianEgyptianEnglishEstonianEthiopianEuropeanFijianFilipinoFinnishFrenchFrench American IndianFrench CanadianGermanGerman RussianGhanaianGreekGuamanian/ChamorroGuatemalanGuyaneseHaitianHmongHonduranHopiHoumaHungarianIcelanderIndian (Asian)IndonesianInupiatIranianIraqiIrishIroquoisIsraeliItalianJamaicanJapaneseJordanianKenyanKiowaKoreanLaotianLatvianLebaneseLiberianLithuanianLumbeeLuxembourgerMacedonianMalaysianMalteseMarshalleseMenomineeMexicanMexican American IndianMongolianMoroccanNative HawaiianNavajoNepaleseNew ZealanderNicaraguanNigerianNorthern EuropeanNorwegianOkinawanOsageOttawaPaiutePakistaniPalestinianPanamanianParaguayanPennsylvania GermanPeruvianPimaPolishPortuguesePotawatomiPuebloPuerto RicanPuget Sound SalishRomanianRussianSalvadoranSamoanScandinavianScotch-IrishScottishSeminoleSenegaleseSerbianShoshoneSierra LeoneanSiouxSlavicSlovakSomaliSouth AfricanSouth AmericanSouth American IndianSoviet UnionSpaniardSpanishSpanish AmericanSpanish American IndianSri LankanSubsaharan AfricanSudaneseSwedishSwissSyrianTaiwaneseThaiTlingit-HaidaTohono O'OdhamTonganTrinidadian and TobagonianTsimshianTurkishU.S. Virgin IslanderUgandanUkrainianUruguayanUteVenezuelanVietnameseWelshWest IndianYakamaYaquiYugoslavianYumanYup'ikZimbabwean
Immigration
NonimmigrantsImmigrantsAfghanistanAfricaAlbaniaArgentinaArmeniaAsiaAustraliaAustriaBahamasBangladeshBarbadosBelarusBelgiumBelizeBoliviaBosnia and HerzegovinaBrazilBulgariaBurma/MyanmarCabo VerdeCambodiaCameroonCanadaCaribbeanCentral AmericaChileChinaColombiaCongoCosta RicaCroatiaCubaCzechoslovakiaDenmarkDominicaDominican RepublicEastern AfricaEastern AsiaEastern EuropeEcuadorEgyptEl SalvadorEnglandEritreaEthiopiaEuropeFijiFranceGermanyGhanaGreeceGrenadaGuatemalaGuyanaHaitiHondurasHong KongHungaryIndiaIndonesiaIranIraqIrelandIsraelItalyJamaicaJapanJordanKazakhstanKenyaKoreaKuwaitLaosLatin AmericaLatviaLebanonLiberiaLithuaniaMalaysiaMexicoMicronesiaMiddle AfricaMoldovaMoroccoNepalNetherlandsNicaraguaNigeriaNorth AmericaNorth MacedoniaNorthern AfricaNorthern EuropeNorwayOceaniaPakistanPanamaPeruPhilippinesPolandPortugalRomaniaRussiaSaudi ArabiaScotlandSenegalSerbiaSierra LeoneSingaporeSomaliaSouth AfricaSouth AmericaSouth Central AsiaSouth Eastern AsiaSouthern EuropeSpainSri LankaSt. Vincent and the GrenadinesSudanSwedenSwitzerlandSyriaTaiwanThailandTrinidad and TobagoTurkeyUgandaUkraineUruguayUzbekistanVenezuelaVietnamWest IndiesWestern AfricaWestern AsiaWestern EuropeYemenZaireZimbabweAzores
Householder Income Over 65 years
Income
Poverty
Unemployment
Labor Participation
Family Structure
Vehicle Availability
Education Level
Disability

Householder Income Over 65 years Comparison

Slovenes

Immigrants from Fiji

Fair
Exceptional
$60,241
HOUSEHOLDER INCOME OVER 65 YEARS
31.8/ 100
METRIC RATING
186th/ 347
METRIC RANK
$64,795
HOUSEHOLDER INCOME OVER 65 YEARS
98.2/ 100
METRIC RATING
82nd/ 347
METRIC RANK

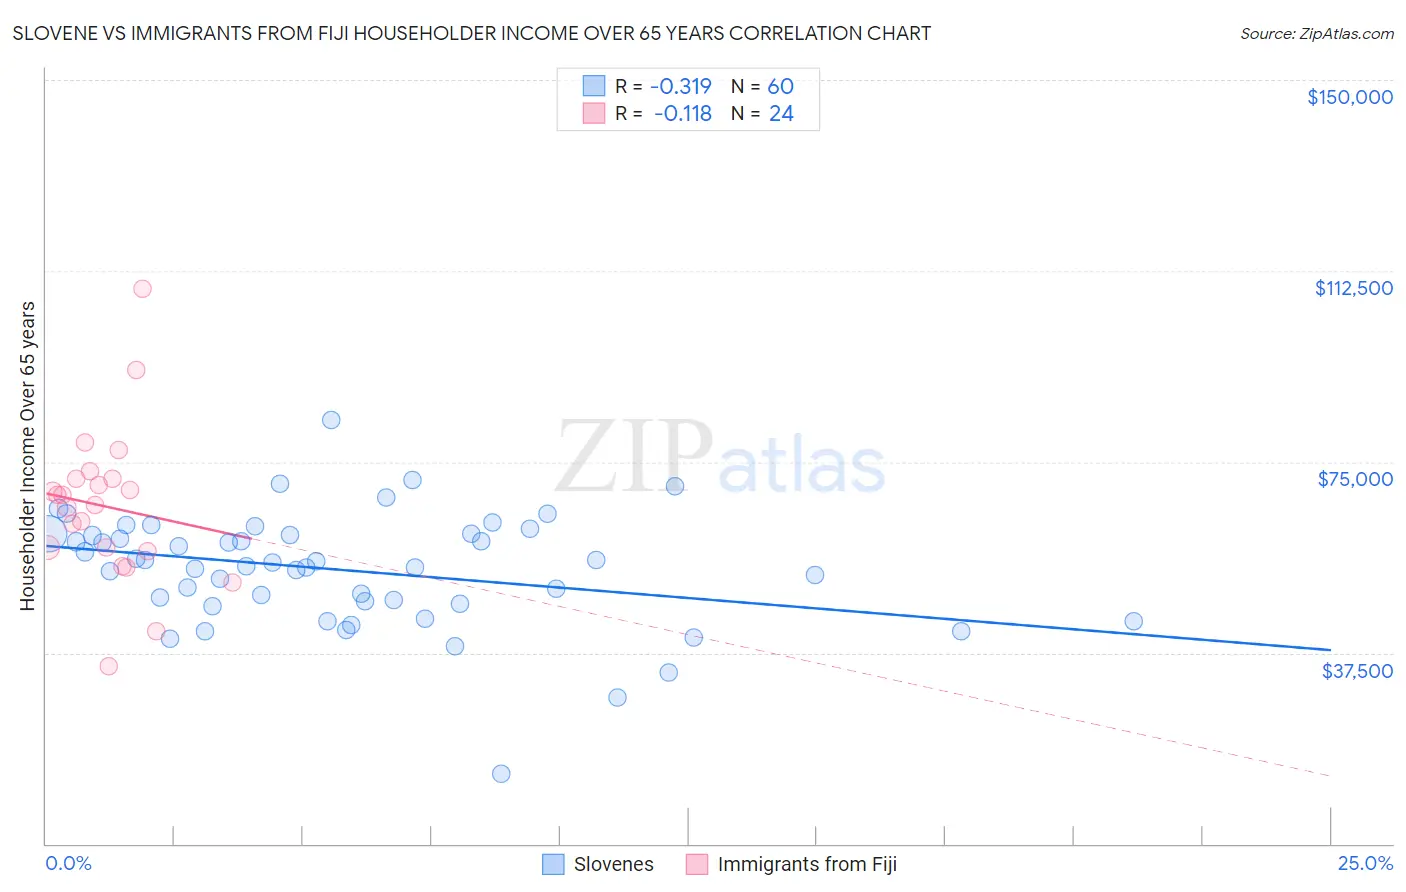
Slovene vs Immigrants from Fiji Householder Income Over 65 years Correlation Chart

The statistical analysis conducted on geographies consisting of 260,915,590 people shows a mild negative correlation between the proportion of Slovenes and household income with householder over the age of 65 in the United States with a correlation coefficient (R) of -0.319 and weighted average of $60,241. Similarly, the statistical analysis conducted on geographies consisting of 93,711,523 people shows a poor negative correlation between the proportion of Immigrants from Fiji and household income with householder over the age of 65 in the United States with a correlation coefficient (R) of -0.118 and weighted average of $64,795, a difference of 7.6%.
Slovene vs Immigrants from Fiji Householder Income Over 65 years

Householder Income Over 65 years Correlation Summary

MeasurementSloveneImmigrants from Fiji
Minimum$13,750$34,792
Maximum$83,108$108,977
Range$69,358$74,185
Mean$53,745$66,250
Median$54,879$67,555
Interquartile 25% (IQ1)$47,317$57,741
Interquartile 75% (IQ3)$60,731$71,770
Interquartile Range (IQR)$13,414$14,029
Standard Deviation (Sample)$11,247$15,202
Standard Deviation (Population)$11,153$14,882

Similar Demographics by Householder Income Over 65 years

Demographics Similar to Slovenes by Householder Income Over 65 years

In terms of householder income over 65 years, the demographic groups most similar to Slovenes are Albanian ($60,249, a difference of 0.010%), Immigrants from Thailand ($60,217, a difference of 0.040%), Immigrants from Eritrea ($60,096, a difference of 0.24%), Ghanaian ($60,043, a difference of 0.33%), and Iraqi ($60,466, a difference of 0.37%).
DemographicsRating | RankHouseholder Income Over 65 years
Welsh
42.2
/100
|
#179
Average
$60,666
Immigrants | Morocco
41.7
/100
|
#180
Average
$60,647
Celtics
40.7
/100
|
#181
Average
$60,608
Czechoslovakians
40.0
/100
|
#182
Average
$60,581
Kenyans
38.4
/100
|
#183
Fair
$60,514
Iraqis
37.2
/100
|
#184
Fair
$60,466
Albanians
32.0
/100
|
#185
Fair
$60,249
Slovenes
31.8
/100
|
#186
Fair
$60,241
Immigrants | Thailand
31.3
/100
|
#187
Fair
$60,217
Immigrants | Eritrea
28.6
/100
|
#188
Fair
$60,096
Ghanaians
27.5
/100
|
#189
Fair
$60,043
Puget Sound Salish
25.3
/100
|
#190
Fair
$59,934
Belgians
24.9
/100
|
#191
Fair
$59,915
South Americans
23.8
/100
|
#192
Fair
$59,854
Immigrants | Costa Rica
23.6
/100
|
#193
Fair
$59,848

Demographics Similar to Immigrants from Fiji by Householder Income Over 65 years

In terms of householder income over 65 years, the demographic groups most similar to Immigrants from Fiji are Immigrants from Europe ($64,828, a difference of 0.050%), Immigrants from North America ($64,856, a difference of 0.090%), Hawaiian ($64,920, a difference of 0.19%), Immigrants from Western Europe ($64,933, a difference of 0.21%), and Northern European ($64,658, a difference of 0.21%).
DemographicsRating | RankHouseholder Income Over 65 years
Sierra Leoneans
98.6
/100
|
#75
Exceptional
$65,038
Ethiopians
98.5
/100
|
#76
Exceptional
$64,989
Immigrants | Canada
98.5
/100
|
#77
Exceptional
$64,952
Immigrants | Western Europe
98.5
/100
|
#78
Exceptional
$64,933
Hawaiians
98.4
/100
|
#79
Exceptional
$64,920
Immigrants | North America
98.3
/100
|
#80
Exceptional
$64,856
Immigrants | Europe
98.3
/100
|
#81
Exceptional
$64,828
Immigrants | Fiji
98.2
/100
|
#82
Exceptional
$64,795
Northern Europeans
97.9
/100
|
#83
Exceptional
$64,658
Immigrants | Greece
97.9
/100
|
#84
Exceptional
$64,636
Immigrants | Lebanon
97.6
/100
|
#85
Exceptional
$64,521
Immigrants | Russia
97.6
/100
|
#86
Exceptional
$64,512
Austrians
97.5
/100
|
#87
Exceptional
$64,470
Immigrants | Romania
97.5
/100
|
#88
Exceptional
$64,462
Paraguayans
97.4
/100
|
#89
Exceptional
$64,443