Immigrants from Laos vs Inupiat Householder Income Over 65 years
COMPARE
Immigrants from Laos
Inupiat
Householder Income Over 65 years
Householder Income Over 65 years Comparison
Immigrants from Laos
Inupiat
$56,722
HOUSEHOLDER INCOME OVER 65 YEARS
1.2/ 100
METRIC RATING
239th/ 347
METRIC RANK
$61,061
HOUSEHOLDER INCOME OVER 65 YEARS
52.4/ 100
METRIC RATING
171st/ 347
METRIC RANK
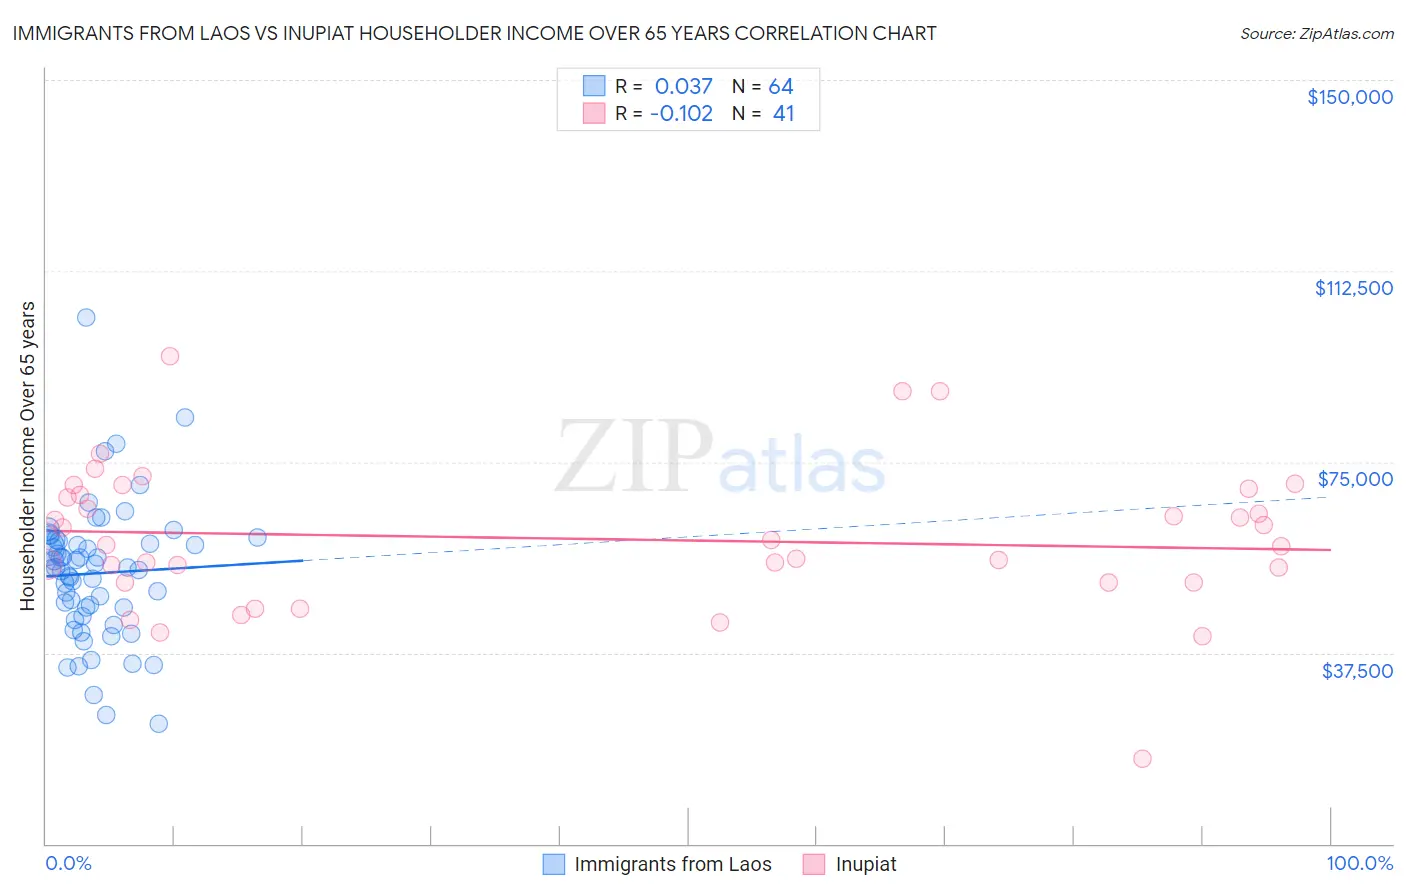
Immigrants from Laos vs Inupiat Householder Income Over 65 years Correlation Chart
The statistical analysis conducted on geographies consisting of 201,251,653 people shows no correlation between the proportion of Immigrants from Laos and household income with householder over the age of 65 in the United States with a correlation coefficient (R) of 0.037 and weighted average of $56,722. Similarly, the statistical analysis conducted on geographies consisting of 96,206,206 people shows a poor negative correlation between the proportion of Inupiat and household income with householder over the age of 65 in the United States with a correlation coefficient (R) of -0.102 and weighted average of $61,061, a difference of 7.6%.
Householder Income Over 65 years Correlation Summary
| Measurement | Immigrants from Laos | Inupiat |
| Minimum | $23,566 | $16,607 |
| Maximum | $103,242 | $95,647 |
| Range | $79,676 | $79,040 |
| Mean | $53,102 | $59,905 |
| Median | $54,158 | $58,687 |
| Interquartile 25% (IQ1) | $45,496 | $51,307 |
| Interquartile 75% (IQ3) | $59,129 | $69,101 |
| Interquartile Range (IQR) | $13,634 | $17,794 |
| Standard Deviation (Sample) | $13,383 | $14,461 |
| Standard Deviation (Population) | $13,278 | $14,284 |
Similar Demographics by Householder Income Over 65 years
Demographics Similar to Immigrants from Laos by Householder Income Over 65 years
In terms of householder income over 65 years, the demographic groups most similar to Immigrants from Laos are Fijian ($56,768, a difference of 0.080%), Subsaharan African ($56,615, a difference of 0.19%), Immigrants from Panama ($56,944, a difference of 0.39%), Immigrants from Guyana ($56,495, a difference of 0.40%), and Immigrants from Uruguay ($56,975, a difference of 0.45%).
| Demographics | Rating | Rank | Householder Income Over 65 years |
| Immigrants | Venezuela | 2.3 /100 | #232 | Tragic $57,371 |
| Immigrants | Western Africa | 1.7 /100 | #233 | Tragic $57,119 |
| Immigrants | Burma/Myanmar | 1.7 /100 | #234 | Tragic $57,114 |
| Spanish Americans | 1.6 /100 | #235 | Tragic $57,021 |
| Immigrants | Uruguay | 1.5 /100 | #236 | Tragic $56,975 |
| Immigrants | Panama | 1.5 /100 | #237 | Tragic $56,944 |
| Fijians | 1.2 /100 | #238 | Tragic $56,768 |
| Immigrants | Laos | 1.2 /100 | #239 | Tragic $56,722 |
| Sub-Saharan Africans | 1.0 /100 | #240 | Tragic $56,615 |
| Immigrants | Guyana | 0.9 /100 | #241 | Tragic $56,495 |
| Yaqui | 0.8 /100 | #242 | Tragic $56,417 |
| Guyanese | 0.8 /100 | #243 | Tragic $56,351 |
| Hmong | 0.8 /100 | #244 | Tragic $56,339 |
| Immigrants | Uzbekistan | 0.8 /100 | #245 | Tragic $56,331 |
| Central Americans | 0.8 /100 | #246 | Tragic $56,321 |
Demographics Similar to Inupiat by Householder Income Over 65 years
In terms of householder income over 65 years, the demographic groups most similar to Inupiat are Immigrants from Poland ($61,041, a difference of 0.030%), Serbian ($61,087, a difference of 0.040%), Carpatho Rusyn ($61,093, a difference of 0.050%), Irish ($61,097, a difference of 0.060%), and Norwegian ($61,104, a difference of 0.070%).
| Demographics | Rating | Rank | Householder Income Over 65 years |
| Immigrants | North Macedonia | 55.4 /100 | #164 | Average $61,175 |
| Immigrants | Ukraine | 55.1 /100 | #165 | Average $61,163 |
| Immigrants | Eastern Africa | 55.0 /100 | #166 | Average $61,157 |
| Norwegians | 53.6 /100 | #167 | Average $61,104 |
| Irish | 53.4 /100 | #168 | Average $61,097 |
| Carpatho Rusyns | 53.3 /100 | #169 | Average $61,093 |
| Serbians | 53.1 /100 | #170 | Average $61,087 |
| Inupiat | 52.4 /100 | #171 | Average $61,061 |
| Immigrants | Poland | 51.9 /100 | #172 | Average $61,041 |
| Immigrants | Micronesia | 50.8 /100 | #173 | Average $61,000 |
| Luxembourgers | 50.0 /100 | #174 | Average $60,967 |
| Spaniards | 47.3 /100 | #175 | Average $60,866 |
| Spanish | 45.5 /100 | #176 | Average $60,795 |
| Alaska Natives | 44.3 /100 | #177 | Average $60,748 |
| Yup'ik | 43.7 /100 | #178 | Average $60,727 |