Slovak vs German Householder Income Over 65 years
COMPARE
Slovak
German
Householder Income Over 65 years
Householder Income Over 65 years Comparison
Slovaks
Germans
$59,039
HOUSEHOLDER INCOME OVER 65 YEARS
11.7/ 100
METRIC RATING
209th/ 347
METRIC RANK
$59,730
HOUSEHOLDER INCOME OVER 65 YEARS
21.5/ 100
METRIC RATING
196th/ 347
METRIC RANK
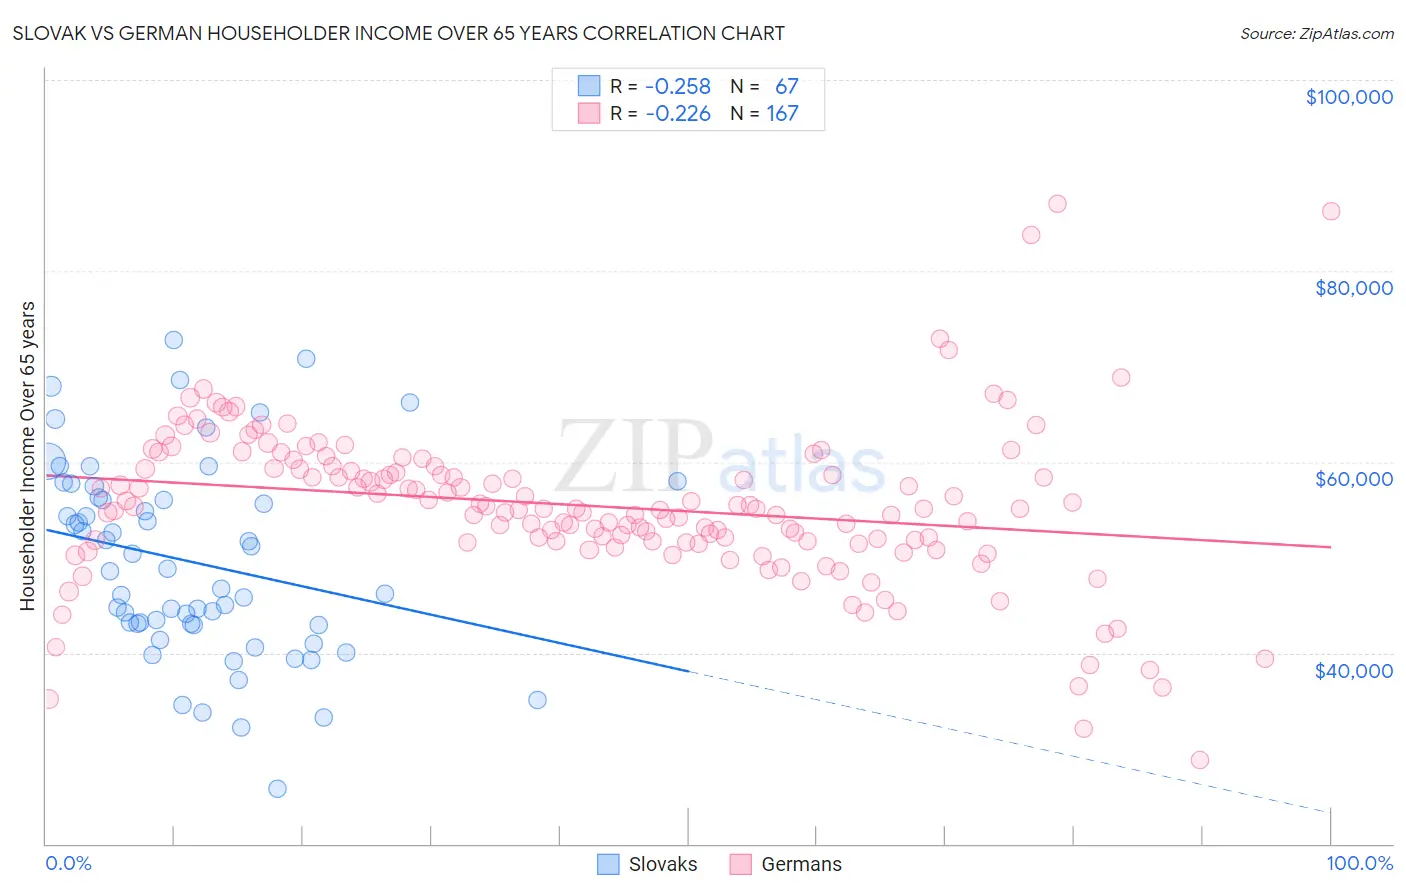
Slovak vs German Householder Income Over 65 years Correlation Chart
The statistical analysis conducted on geographies consisting of 396,632,893 people shows a weak negative correlation between the proportion of Slovaks and household income with householder over the age of 65 in the United States with a correlation coefficient (R) of -0.258 and weighted average of $59,039. Similarly, the statistical analysis conducted on geographies consisting of 574,269,506 people shows a weak negative correlation between the proportion of Germans and household income with householder over the age of 65 in the United States with a correlation coefficient (R) of -0.226 and weighted average of $59,730, a difference of 1.2%.
Householder Income Over 65 years Correlation Summary
| Measurement | Slovak | German |
| Minimum | $25,719 | $28,750 |
| Maximum | $72,768 | $86,983 |
| Range | $47,049 | $58,233 |
| Mean | $49,485 | $55,396 |
| Median | $48,589 | $55,057 |
| Interquartile 25% (IQ1) | $42,955 | $51,633 |
| Interquartile 75% (IQ3) | $56,267 | $59,523 |
| Interquartile Range (IQR) | $13,312 | $7,890 |
| Standard Deviation (Sample) | $10,187 | $8,316 |
| Standard Deviation (Population) | $10,111 | $8,291 |
Demographics Similar to Slovaks and Germans by Householder Income Over 65 years
In terms of householder income over 65 years, the demographic groups most similar to Slovaks are Nigerian ($58,992, a difference of 0.080%), Uruguayan ($59,090, a difference of 0.090%), Immigrants from Nigeria ($58,942, a difference of 0.16%), Salvadoran ($59,141, a difference of 0.17%), and Immigrants from South America ($59,151, a difference of 0.19%). Similarly, the demographic groups most similar to Germans are Immigrants from Kenya ($59,710, a difference of 0.030%), Moroccan ($59,683, a difference of 0.080%), Immigrants ($59,656, a difference of 0.12%), French ($59,656, a difference of 0.12%), and Immigrants from Iraq ($59,824, a difference of 0.16%).
| Demographics | Rating | Rank | Householder Income Over 65 years |
| South Americans | 23.8 /100 | #192 | Fair $59,854 |
| Immigrants | Costa Rica | 23.6 /100 | #193 | Fair $59,848 |
| Immigrants | Africa | 23.4 /100 | #194 | Fair $59,837 |
| Immigrants | Iraq | 23.2 /100 | #195 | Fair $59,824 |
| Germans | 21.5 /100 | #196 | Fair $59,730 |
| Immigrants | Kenya | 21.1 /100 | #197 | Fair $59,710 |
| Moroccans | 20.7 /100 | #198 | Fair $59,683 |
| Immigrants | Immigrants | 20.2 /100 | #199 | Fair $59,656 |
| French | 20.2 /100 | #200 | Fair $59,656 |
| Dutch | 18.3 /100 | #201 | Poor $59,539 |
| Finns | 18.2 /100 | #202 | Poor $59,535 |
| Scotch-Irish | 16.9 /100 | #203 | Poor $59,447 |
| Arapaho | 16.0 /100 | #204 | Poor $59,383 |
| Immigrants | Sudan | 14.2 /100 | #205 | Poor $59,248 |
| Immigrants | South America | 13.0 /100 | #206 | Poor $59,151 |
| Salvadorans | 12.9 /100 | #207 | Poor $59,141 |
| Uruguayans | 12.3 /100 | #208 | Poor $59,090 |
| Slovaks | 11.7 /100 | #209 | Poor $59,039 |
| Nigerians | 11.2 /100 | #210 | Poor $58,992 |
| Immigrants | Nigeria | 10.7 /100 | #211 | Poor $58,942 |
| Colombians | 9.8 /100 | #212 | Tragic $58,851 |