Sioux vs Immigrants from Asia Median Household Income
COMPARE
Sioux
Immigrants from Asia
Median Household Income
Median Household Income Comparison
Sioux
Immigrants from Asia
$67,792
MEDIAN HOUSEHOLD INCOME
0.0/ 100
METRIC RATING
332nd/ 347
METRIC RANK
$99,933
MEDIAN HOUSEHOLD INCOME
100.0/ 100
METRIC RATING
29th/ 347
METRIC RANK
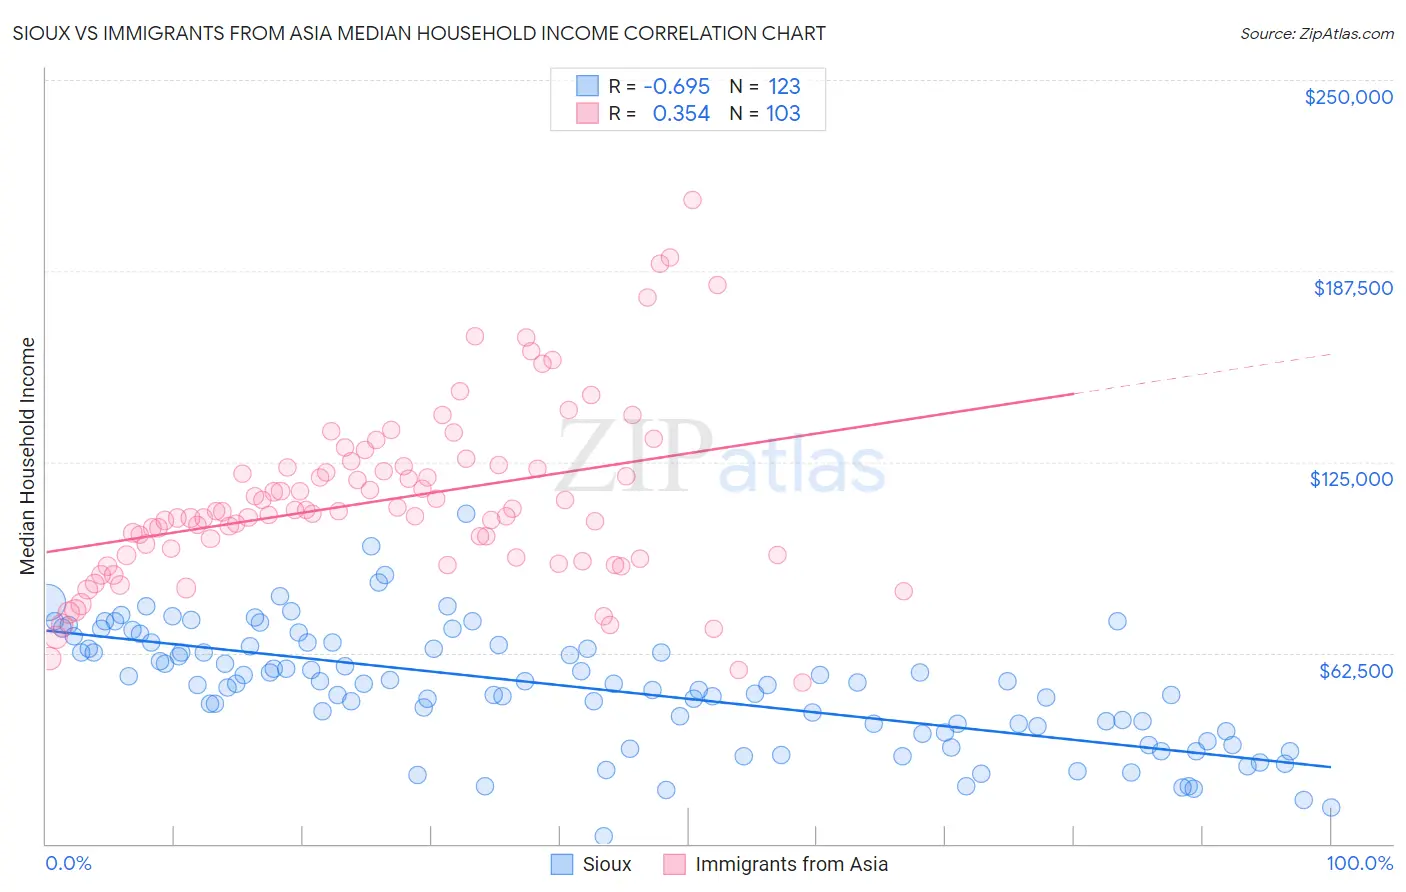
Sioux vs Immigrants from Asia Median Household Income Correlation Chart
The statistical analysis conducted on geographies consisting of 234,052,794 people shows a significant negative correlation between the proportion of Sioux and median household income in the United States with a correlation coefficient (R) of -0.695 and weighted average of $67,792. Similarly, the statistical analysis conducted on geographies consisting of 548,273,530 people shows a mild positive correlation between the proportion of Immigrants from Asia and median household income in the United States with a correlation coefficient (R) of 0.354 and weighted average of $99,933, a difference of 47.4%.
Median Household Income Correlation Summary
| Measurement | Sioux | Immigrants from Asia |
| Minimum | $2,499 | $52,658 |
| Maximum | $108,000 | $210,660 |
| Range | $105,501 | $158,002 |
| Mean | $51,141 | $112,443 |
| Median | $52,399 | $108,674 |
| Interquartile 25% (IQ1) | $36,923 | $93,690 |
| Interquartile 75% (IQ3) | $65,000 | $123,452 |
| Interquartile Range (IQR) | $28,077 | $29,762 |
| Standard Deviation (Sample) | $19,497 | $28,979 |
| Standard Deviation (Population) | $19,417 | $28,838 |
Similar Demographics by Median Household Income
Demographics Similar to Sioux by Median Household Income
In terms of median household income, the demographic groups most similar to Sioux are Creek ($67,715, a difference of 0.11%), Native/Alaskan ($67,879, a difference of 0.13%), Arapaho ($67,965, a difference of 0.25%), Black/African American ($67,573, a difference of 0.32%), and Dutch West Indian ($68,412, a difference of 0.91%).
| Demographics | Rating | Rank | Median Household Income |
| Seminole | 0.0 /100 | #325 | Tragic $69,420 |
| Yuman | 0.0 /100 | #326 | Tragic $68,743 |
| Immigrants | Cuba | 0.0 /100 | #327 | Tragic $68,461 |
| Menominee | 0.0 /100 | #328 | Tragic $68,423 |
| Dutch West Indians | 0.0 /100 | #329 | Tragic $68,412 |
| Arapaho | 0.0 /100 | #330 | Tragic $67,965 |
| Natives/Alaskans | 0.0 /100 | #331 | Tragic $67,879 |
| Sioux | 0.0 /100 | #332 | Tragic $67,792 |
| Creek | 0.0 /100 | #333 | Tragic $67,715 |
| Blacks/African Americans | 0.0 /100 | #334 | Tragic $67,573 |
| Cheyenne | 0.0 /100 | #335 | Tragic $66,974 |
| Immigrants | Congo | 0.0 /100 | #336 | Tragic $66,768 |
| Kiowa | 0.0 /100 | #337 | Tragic $65,914 |
| Immigrants | Yemen | 0.0 /100 | #338 | Tragic $65,194 |
| Hopi | 0.0 /100 | #339 | Tragic $65,043 |
Demographics Similar to Immigrants from Asia by Median Household Income
In terms of median household income, the demographic groups most similar to Immigrants from Asia are Immigrants from Sri Lanka ($99,943, a difference of 0.010%), Immigrants from Northern Europe ($99,813, a difference of 0.12%), Bhutanese ($100,151, a difference of 0.22%), Immigrants from Belgium ($100,306, a difference of 0.37%), and Turkish ($99,389, a difference of 0.55%).
| Demographics | Rating | Rank | Median Household Income |
| Asians | 100.0 /100 | #22 | Exceptional $101,681 |
| Immigrants | Bolivia | 100.0 /100 | #23 | Exceptional $101,394 |
| Immigrants | Japan | 100.0 /100 | #24 | Exceptional $100,711 |
| Immigrants | Sweden | 100.0 /100 | #25 | Exceptional $100,699 |
| Immigrants | Belgium | 100.0 /100 | #26 | Exceptional $100,306 |
| Bhutanese | 100.0 /100 | #27 | Exceptional $100,151 |
| Immigrants | Sri Lanka | 100.0 /100 | #28 | Exceptional $99,943 |
| Immigrants | Asia | 100.0 /100 | #29 | Exceptional $99,933 |
| Immigrants | Northern Europe | 100.0 /100 | #30 | Exceptional $99,813 |
| Turks | 100.0 /100 | #31 | Exceptional $99,389 |
| Immigrants | Denmark | 100.0 /100 | #32 | Exceptional $98,510 |
| Chinese | 100.0 /100 | #33 | Exceptional $98,496 |
| Russians | 100.0 /100 | #34 | Exceptional $98,008 |
| Immigrants | Switzerland | 100.0 /100 | #35 | Exceptional $97,979 |
| Immigrants | Pakistan | 100.0 /100 | #36 | Exceptional $97,528 |