Scottish vs Ottawa Median Household Income
COMPARE
Scottish
Ottawa
Median Household Income
Median Household Income Comparison
Scottish
Ottawa
$85,101
MEDIAN HOUSEHOLD INCOME
50.0/ 100
METRIC RATING
174th/ 347
METRIC RANK
$70,984
MEDIAN HOUSEHOLD INCOME
0.0/ 100
METRIC RATING
315th/ 347
METRIC RANK
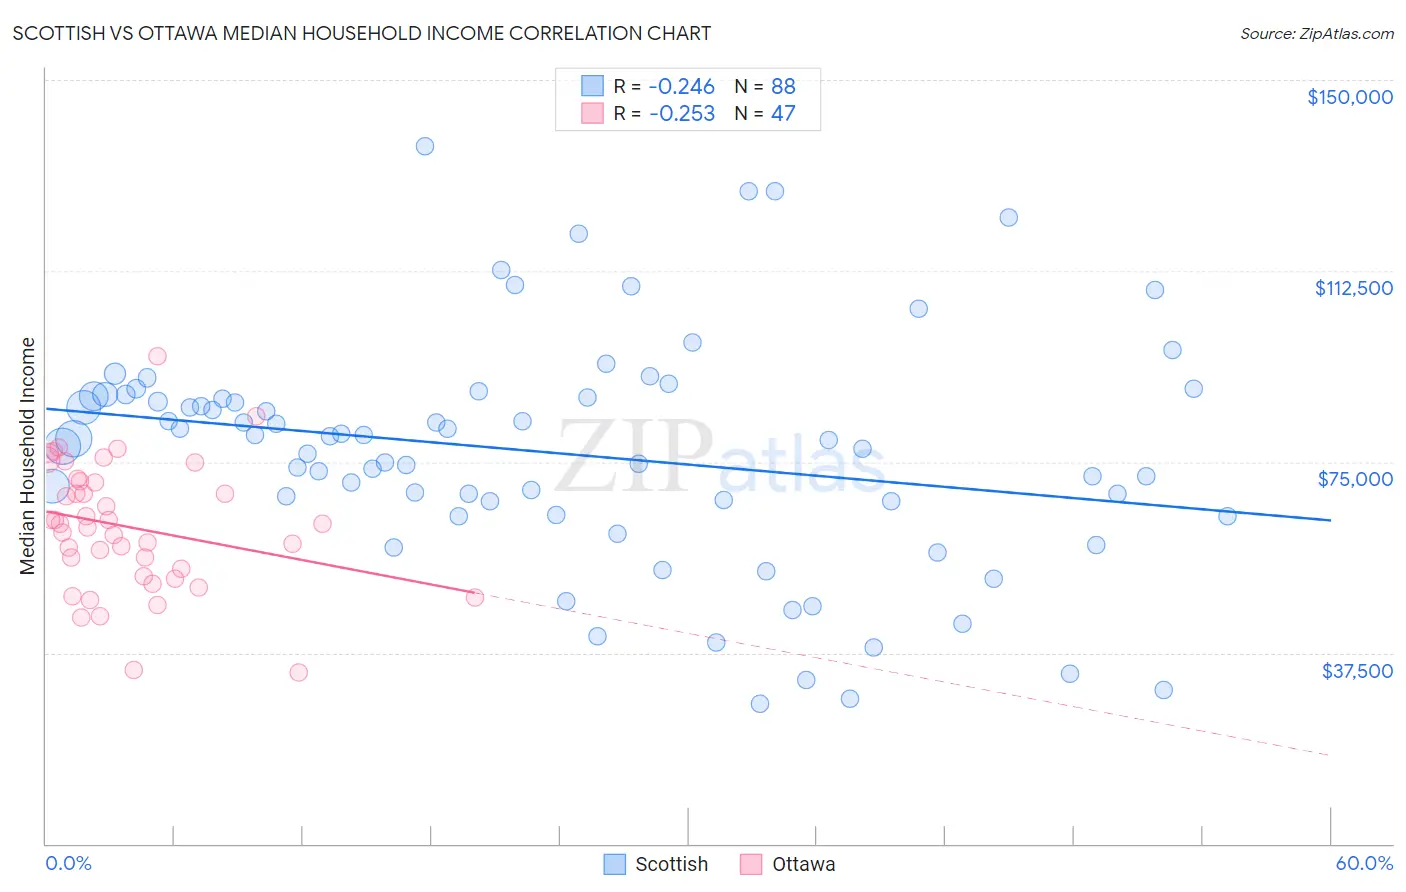
Scottish vs Ottawa Median Household Income Correlation Chart
The statistical analysis conducted on geographies consisting of 566,054,944 people shows a weak negative correlation between the proportion of Scottish and median household income in the United States with a correlation coefficient (R) of -0.246 and weighted average of $85,101. Similarly, the statistical analysis conducted on geographies consisting of 49,944,469 people shows a weak negative correlation between the proportion of Ottawa and median household income in the United States with a correlation coefficient (R) of -0.253 and weighted average of $70,984, a difference of 19.9%.
Median Household Income Correlation Summary
| Measurement | Scottish | Ottawa |
| Minimum | $27,500 | $33,750 |
| Maximum | $136,980 | $95,750 |
| Range | $109,480 | $62,000 |
| Mean | $76,735 | $62,197 |
| Median | $79,406 | $62,810 |
| Interquartile 25% (IQ1) | $65,944 | $52,443 |
| Interquartile 75% (IQ3) | $88,035 | $71,315 |
| Interquartile Range (IQR) | $22,091 | $18,872 |
| Standard Deviation (Sample) | $22,770 | $12,658 |
| Standard Deviation (Population) | $22,640 | $12,523 |
Similar Demographics by Median Household Income
Demographics Similar to Scottish by Median Household Income
In terms of median household income, the demographic groups most similar to Scottish are Immigrants from Costa Rica ($85,054, a difference of 0.050%), Alsatian ($85,053, a difference of 0.060%), Immigrants from Eritrea ($85,025, a difference of 0.090%), Czechoslovakian ($84,965, a difference of 0.16%), and English ($84,915, a difference of 0.22%).
| Demographics | Rating | Rank | Median Household Income |
| Immigrants | Immigrants | 61.3 /100 | #167 | Good $85,818 |
| Icelanders | 61.0 /100 | #168 | Good $85,797 |
| Colombians | 59.7 /100 | #169 | Average $85,716 |
| Swiss | 59.2 /100 | #170 | Average $85,681 |
| Immigrants | South America | 58.1 /100 | #171 | Average $85,611 |
| Slovenes | 57.4 /100 | #172 | Average $85,562 |
| Immigrants | Cameroon | 53.4 /100 | #173 | Average $85,314 |
| Scottish | 50.0 /100 | #174 | Average $85,101 |
| Immigrants | Costa Rica | 49.2 /100 | #175 | Average $85,054 |
| Alsatians | 49.2 /100 | #176 | Average $85,053 |
| Immigrants | Eritrea | 48.8 /100 | #177 | Average $85,025 |
| Czechoslovakians | 47.8 /100 | #178 | Average $84,965 |
| English | 47.0 /100 | #179 | Average $84,915 |
| Immigrants | Portugal | 44.2 /100 | #180 | Average $84,740 |
| Hawaiians | 44.1 /100 | #181 | Average $84,729 |
Demographics Similar to Ottawa by Median Household Income
In terms of median household income, the demographic groups most similar to Ottawa are Apache ($70,927, a difference of 0.080%), Dominican ($71,302, a difference of 0.45%), Immigrants from Bahamas ($71,349, a difference of 0.51%), Cajun ($70,605, a difference of 0.54%), and Chippewa ($70,539, a difference of 0.63%).
| Demographics | Rating | Rank | Median Household Income |
| Yakama | 0.0 /100 | #308 | Tragic $72,225 |
| Immigrants | Caribbean | 0.0 /100 | #309 | Tragic $71,860 |
| U.S. Virgin Islanders | 0.0 /100 | #310 | Tragic $71,853 |
| Immigrants | Zaire | 0.0 /100 | #311 | Tragic $71,801 |
| Immigrants | Honduras | 0.0 /100 | #312 | Tragic $71,452 |
| Immigrants | Bahamas | 0.0 /100 | #313 | Tragic $71,349 |
| Dominicans | 0.0 /100 | #314 | Tragic $71,302 |
| Ottawa | 0.0 /100 | #315 | Tragic $70,984 |
| Apache | 0.0 /100 | #316 | Tragic $70,927 |
| Cajuns | 0.0 /100 | #317 | Tragic $70,605 |
| Chippewa | 0.0 /100 | #318 | Tragic $70,539 |
| Immigrants | Dominican Republic | 0.0 /100 | #319 | Tragic $70,208 |
| Colville | 0.0 /100 | #320 | Tragic $70,094 |
| Chickasaw | 0.0 /100 | #321 | Tragic $70,005 |
| Choctaw | 0.0 /100 | #322 | Tragic $69,947 |