Barbadian vs Immigrants from Nigeria Median Family Income
COMPARE
Barbadian
Immigrants from Nigeria
Median Family Income
Median Family Income Comparison
Barbadians
Immigrants from Nigeria
$93,919
MEDIAN FAMILY INCOME
1.1/ 100
METRIC RATING
242nd/ 347
METRIC RANK
$96,439
MEDIAN FAMILY INCOME
4.0/ 100
METRIC RATING
222nd/ 347
METRIC RANK
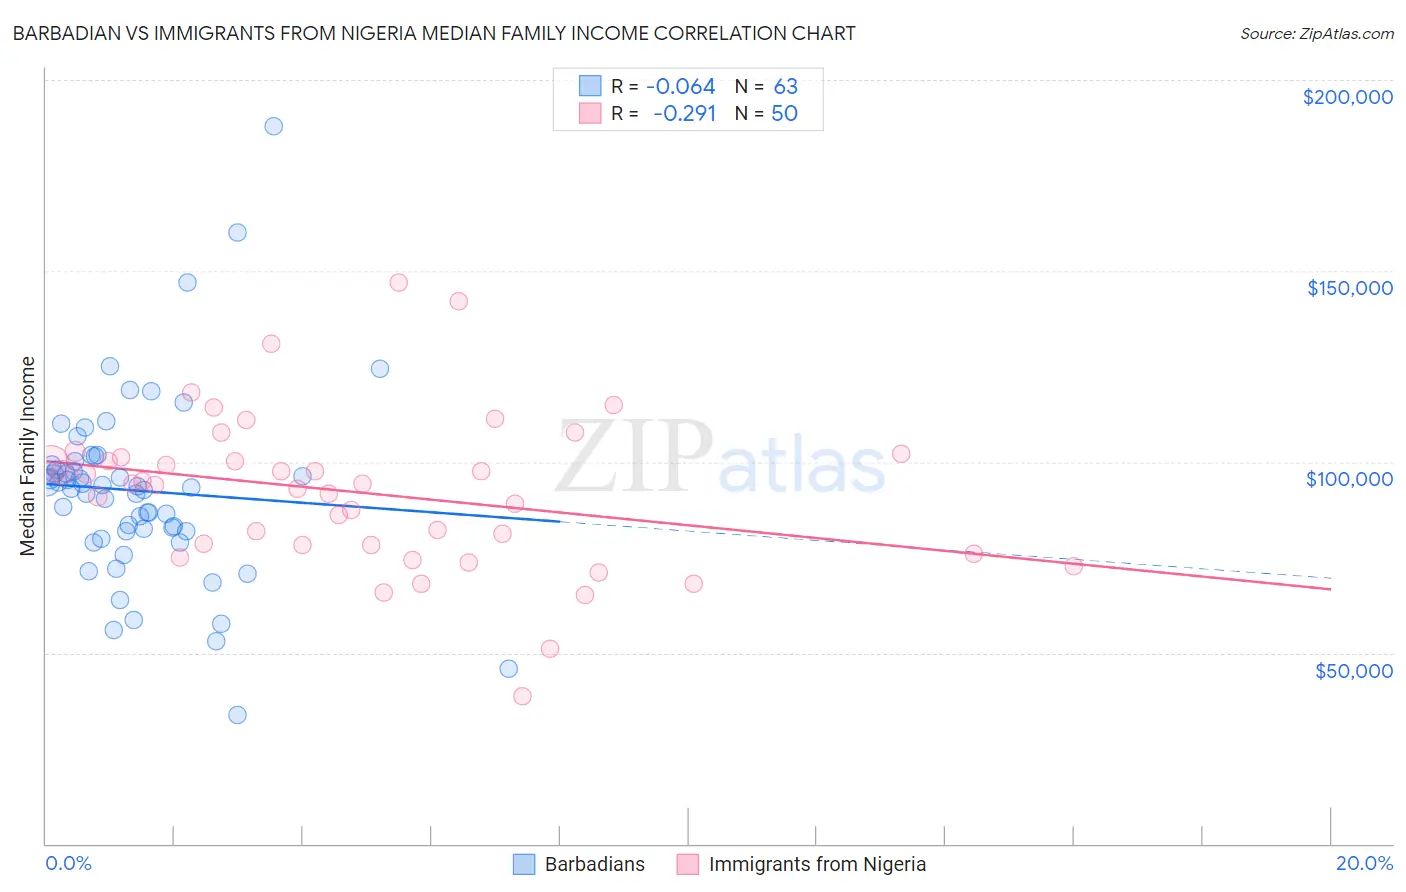
Barbadian vs Immigrants from Nigeria Median Family Income Correlation Chart
The statistical analysis conducted on geographies consisting of 141,221,123 people shows a slight negative correlation between the proportion of Barbadians and median family income in the United States with a correlation coefficient (R) of -0.064 and weighted average of $93,919. Similarly, the statistical analysis conducted on geographies consisting of 283,210,915 people shows a weak negative correlation between the proportion of Immigrants from Nigeria and median family income in the United States with a correlation coefficient (R) of -0.291 and weighted average of $96,439, a difference of 2.7%.
Median Family Income Correlation Summary
| Measurement | Barbadian | Immigrants from Nigeria |
| Minimum | $33,750 | $38,750 |
| Maximum | $188,047 | $147,129 |
| Range | $154,297 | $108,379 |
| Mean | $92,437 | $91,848 |
| Median | $93,405 | $94,194 |
| Interquartile 25% (IQ1) | $81,674 | $78,280 |
| Interquartile 75% (IQ3) | $100,271 | $101,295 |
| Interquartile Range (IQR) | $18,597 | $23,014 |
| Standard Deviation (Sample) | $24,591 | $20,578 |
| Standard Deviation (Population) | $24,395 | $20,371 |
Demographics Similar to Barbadians and Immigrants from Nigeria by Median Family Income
In terms of median family income, the demographic groups most similar to Barbadians are Immigrants from Trinidad and Tobago ($93,988, a difference of 0.070%), Somali ($94,085, a difference of 0.18%), Salvadoran ($94,109, a difference of 0.20%), Nepalese ($94,153, a difference of 0.25%), and Alaskan Athabascan ($94,429, a difference of 0.54%). Similarly, the demographic groups most similar to Immigrants from Nigeria are Venezuelan ($96,281, a difference of 0.16%), Nonimmigrants ($96,231, a difference of 0.22%), Vietnamese ($96,123, a difference of 0.33%), Immigrants from Panama ($95,647, a difference of 0.83%), and Alaska Native ($95,573, a difference of 0.91%).
| Demographics | Rating | Rank | Median Family Income |
| Immigrants | Nigeria | 4.0 /100 | #222 | Tragic $96,439 |
| Venezuelans | 3.7 /100 | #223 | Tragic $96,281 |
| Immigrants | Nonimmigrants | 3.6 /100 | #224 | Tragic $96,231 |
| Vietnamese | 3.4 /100 | #225 | Tragic $96,123 |
| Immigrants | Panama | 2.7 /100 | #226 | Tragic $95,647 |
| Alaska Natives | 2.6 /100 | #227 | Tragic $95,573 |
| Immigrants | Azores | 2.4 /100 | #228 | Tragic $95,402 |
| Marshallese | 2.2 /100 | #229 | Tragic $95,293 |
| Malaysians | 2.2 /100 | #230 | Tragic $95,230 |
| Ecuadorians | 2.1 /100 | #231 | Tragic $95,114 |
| Immigrants | Venezuela | 1.9 /100 | #232 | Tragic $94,904 |
| Immigrants | Bangladesh | 1.6 /100 | #233 | Tragic $94,665 |
| Immigrants | Western Africa | 1.6 /100 | #234 | Tragic $94,638 |
| Immigrants | Burma/Myanmar | 1.5 /100 | #235 | Tragic $94,472 |
| Trinidadians and Tobagonians | 1.5 /100 | #236 | Tragic $94,466 |
| Alaskan Athabascans | 1.5 /100 | #237 | Tragic $94,429 |
| Nepalese | 1.3 /100 | #238 | Tragic $94,153 |
| Salvadorans | 1.2 /100 | #239 | Tragic $94,109 |
| Somalis | 1.2 /100 | #240 | Tragic $94,085 |
| Immigrants | Trinidad and Tobago | 1.2 /100 | #241 | Tragic $93,988 |
| Barbadians | 1.1 /100 | #242 | Tragic $93,919 |