Immigrants from Somalia vs British West Indian Median Male Earnings
COMPARE
Immigrants from Somalia
British West Indian
Median Male Earnings
Median Male Earnings Comparison
Immigrants from Somalia
British West Indians
$48,439
MEDIAN MALE EARNINGS
0.3/ 100
METRIC RATING
275th/ 347
METRIC RANK
$49,636
MEDIAN MALE EARNINGS
0.8/ 100
METRIC RATING
257th/ 347
METRIC RANK
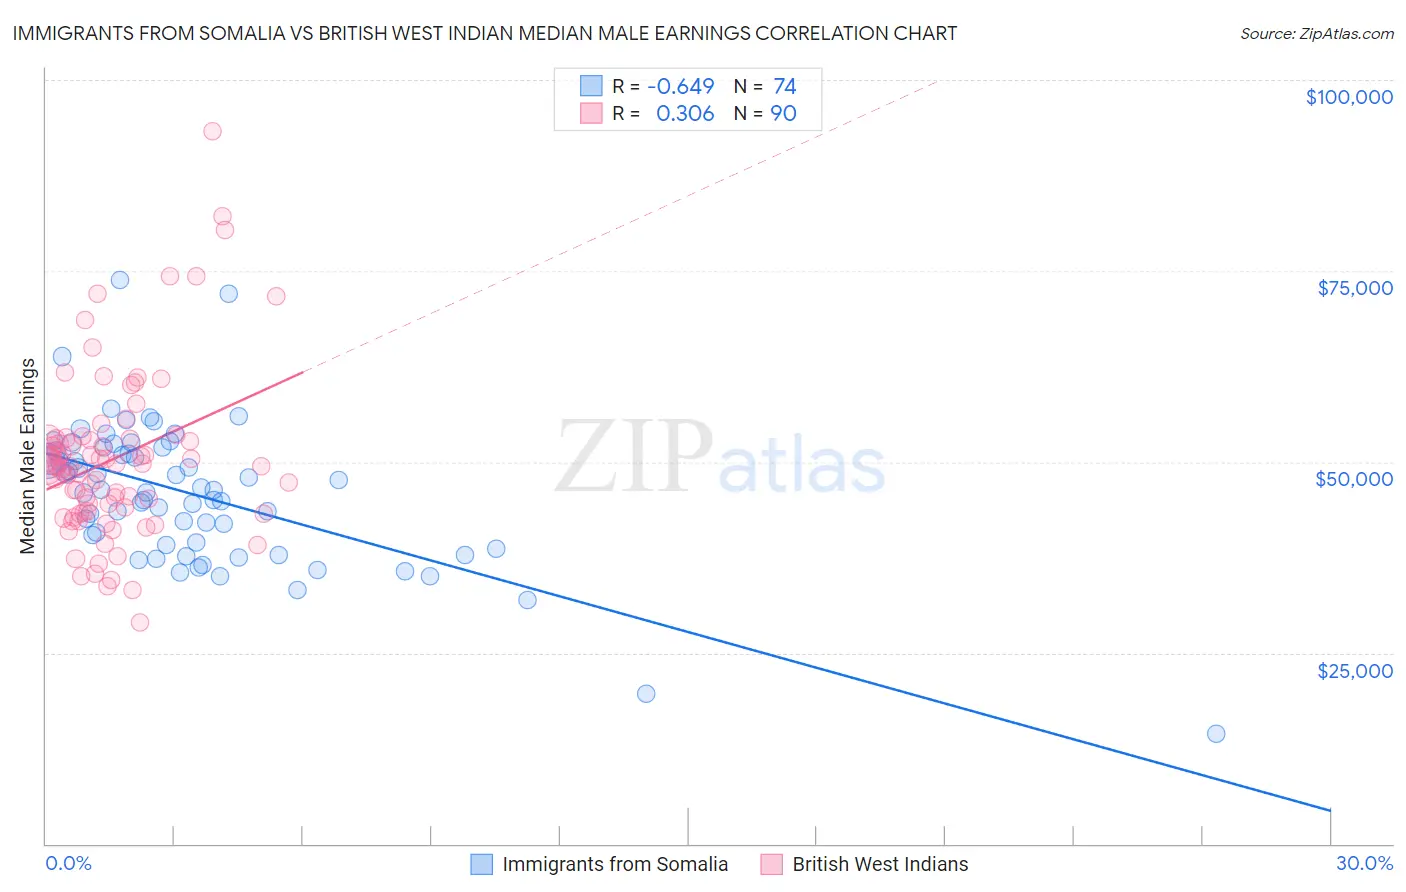
Immigrants from Somalia vs British West Indian Median Male Earnings Correlation Chart
The statistical analysis conducted on geographies consisting of 92,109,982 people shows a significant negative correlation between the proportion of Immigrants from Somalia and median male earnings in the United States with a correlation coefficient (R) of -0.649 and weighted average of $48,439. Similarly, the statistical analysis conducted on geographies consisting of 152,683,188 people shows a mild positive correlation between the proportion of British West Indians and median male earnings in the United States with a correlation coefficient (R) of 0.306 and weighted average of $49,636, a difference of 2.5%.
Median Male Earnings Correlation Summary
| Measurement | Immigrants from Somalia | British West Indian |
| Minimum | $14,382 | $28,979 |
| Maximum | $73,796 | $93,333 |
| Range | $59,414 | $64,354 |
| Mean | $45,683 | $50,358 |
| Median | $46,151 | $49,413 |
| Interquartile 25% (IQ1) | $39,154 | $43,337 |
| Interquartile 75% (IQ3) | $51,463 | $53,079 |
| Interquartile Range (IQR) | $12,309 | $9,742 |
| Standard Deviation (Sample) | $9,409 | $11,060 |
| Standard Deviation (Population) | $9,346 | $10,999 |
Demographics Similar to Immigrants from Somalia and British West Indians by Median Male Earnings
In terms of median male earnings, the demographic groups most similar to Immigrants from Somalia are Blackfeet ($48,402, a difference of 0.080%), Colville ($48,516, a difference of 0.16%), Jamaican ($48,632, a difference of 0.40%), Salvadoran ($48,646, a difference of 0.43%), and Cherokee ($48,669, a difference of 0.48%). Similarly, the demographic groups most similar to British West Indians are Alaska Native ($49,711, a difference of 0.15%), Cree ($49,497, a difference of 0.28%), Nepalese ($49,458, a difference of 0.36%), Iroquois ($49,374, a difference of 0.53%), and Liberian ($49,318, a difference of 0.64%).
| Demographics | Rating | Rank | Median Male Earnings |
| Alaska Natives | 0.9 /100 | #256 | Tragic $49,711 |
| British West Indians | 0.8 /100 | #257 | Tragic $49,636 |
| Cree | 0.7 /100 | #258 | Tragic $49,497 |
| Nepalese | 0.7 /100 | #259 | Tragic $49,458 |
| Iroquois | 0.7 /100 | #260 | Tragic $49,374 |
| Liberians | 0.6 /100 | #261 | Tragic $49,318 |
| Immigrants | West Indies | 0.6 /100 | #262 | Tragic $49,271 |
| Nicaraguans | 0.6 /100 | #263 | Tragic $49,215 |
| Immigrants | Middle Africa | 0.6 /100 | #264 | Tragic $49,201 |
| Immigrants | Laos | 0.6 /100 | #265 | Tragic $49,190 |
| Somalis | 0.5 /100 | #266 | Tragic $49,025 |
| Spanish Americans | 0.5 /100 | #267 | Tragic $49,008 |
| Ute | 0.4 /100 | #268 | Tragic $48,899 |
| Tsimshian | 0.4 /100 | #269 | Tragic $48,836 |
| Potawatomi | 0.4 /100 | #270 | Tragic $48,768 |
| Cherokee | 0.3 /100 | #271 | Tragic $48,669 |
| Salvadorans | 0.3 /100 | #272 | Tragic $48,646 |
| Jamaicans | 0.3 /100 | #273 | Tragic $48,632 |
| Colville | 0.3 /100 | #274 | Tragic $48,516 |
| Immigrants | Somalia | 0.3 /100 | #275 | Tragic $48,439 |
| Blackfeet | 0.3 /100 | #276 | Tragic $48,402 |