Sierra Leonean vs British Per Capita Income
COMPARE
Sierra Leonean
British
Per Capita Income
Per Capita Income Comparison
Sierra Leoneans
British
$43,405
PER CAPITA INCOME
42.9/ 100
METRIC RATING
180th/ 347
METRIC RANK
$46,571
PER CAPITA INCOME
96.3/ 100
METRIC RATING
105th/ 347
METRIC RANK
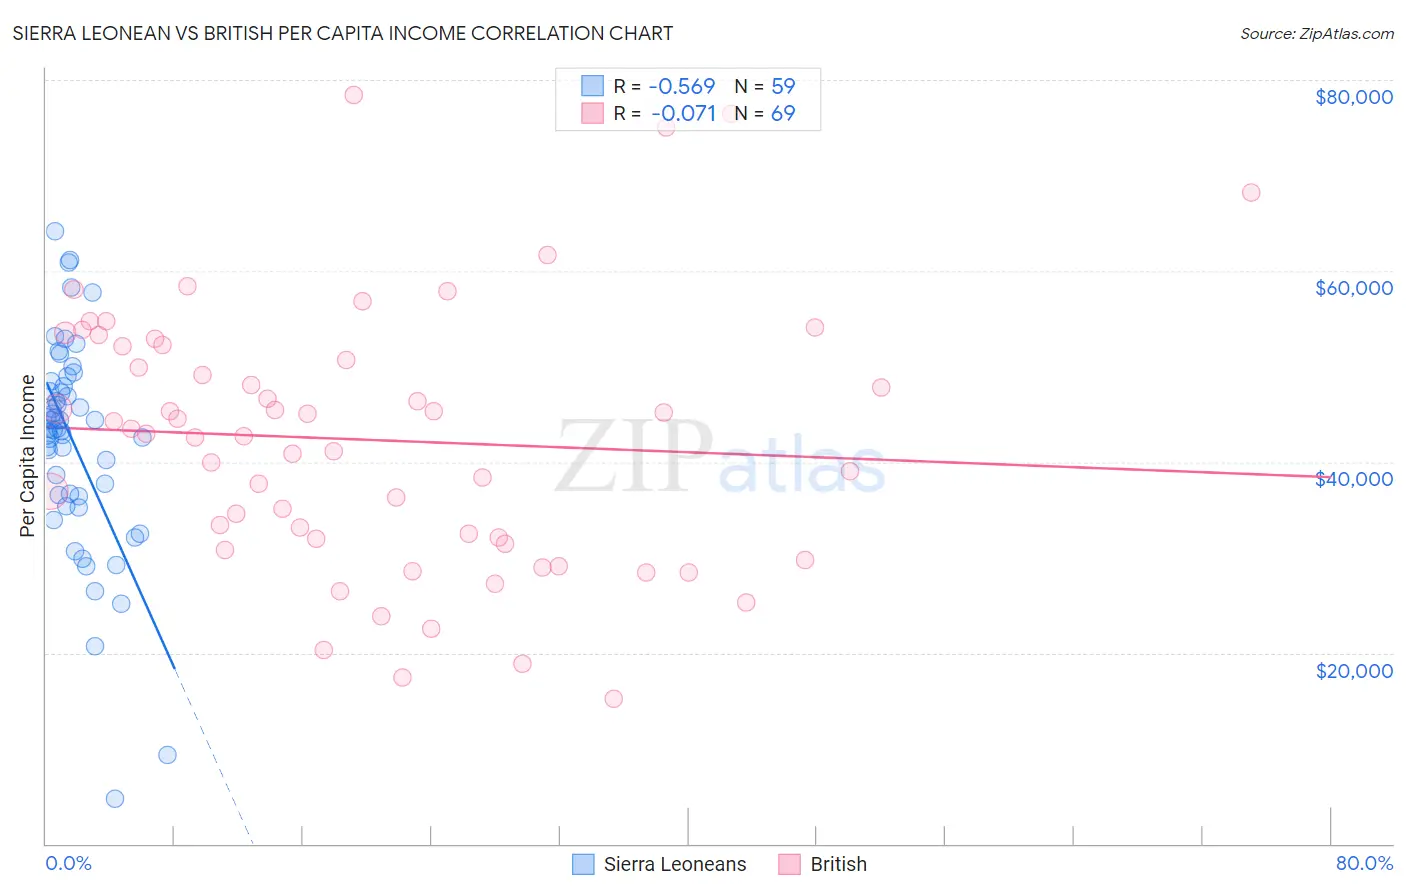
Sierra Leonean vs British Per Capita Income Correlation Chart
The statistical analysis conducted on geographies consisting of 83,350,653 people shows a substantial negative correlation between the proportion of Sierra Leoneans and per capita income in the United States with a correlation coefficient (R) of -0.569 and weighted average of $43,405. Similarly, the statistical analysis conducted on geographies consisting of 531,509,252 people shows a slight negative correlation between the proportion of British and per capita income in the United States with a correlation coefficient (R) of -0.071 and weighted average of $46,571, a difference of 7.3%.
Per Capita Income Correlation Summary
| Measurement | Sierra Leonean | British |
| Minimum | $4,657 | $15,188 |
| Maximum | $64,096 | $78,420 |
| Range | $59,439 | $63,232 |
| Mean | $41,867 | $42,295 |
| Median | $43,497 | $42,961 |
| Interquartile 25% (IQ1) | $36,386 | $31,698 |
| Interquartile 75% (IQ3) | $47,973 | $52,162 |
| Interquartile Range (IQR) | $11,587 | $20,464 |
| Standard Deviation (Sample) | $11,153 | $13,799 |
| Standard Deviation (Population) | $11,058 | $13,699 |
Similar Demographics by Per Capita Income
Demographics Similar to Sierra Leoneans by Per Capita Income
In terms of per capita income, the demographic groups most similar to Sierra Leoneans are Finnish ($43,461, a difference of 0.13%), Immigrants from Costa Rica ($43,464, a difference of 0.14%), Tlingit-Haida ($43,516, a difference of 0.25%), Immigrants from South Eastern Asia ($43,539, a difference of 0.31%), and Welsh ($43,233, a difference of 0.40%).
| Demographics | Rating | Rank | Per Capita Income |
| French | 50.7 /100 | #173 | Average $43,685 |
| Colombians | 50.0 /100 | #174 | Average $43,661 |
| Celtics | 48.9 /100 | #175 | Average $43,621 |
| Immigrants | South Eastern Asia | 46.6 /100 | #176 | Average $43,539 |
| Tlingit-Haida | 45.9 /100 | #177 | Average $43,516 |
| Immigrants | Costa Rica | 44.5 /100 | #178 | Average $43,464 |
| Finns | 44.4 /100 | #179 | Average $43,461 |
| Sierra Leoneans | 42.9 /100 | #180 | Average $43,405 |
| Welsh | 38.2 /100 | #181 | Fair $43,233 |
| Immigrants | Vietnam | 38.1 /100 | #182 | Fair $43,229 |
| Germans | 33.9 /100 | #183 | Fair $43,067 |
| Spaniards | 32.9 /100 | #184 | Fair $43,028 |
| Immigrants | Immigrants | 32.5 /100 | #185 | Fair $43,010 |
| French Canadians | 32.3 /100 | #186 | Fair $43,003 |
| Immigrants | Colombia | 31.5 /100 | #187 | Fair $42,971 |
Demographics Similar to British by Per Capita Income
In terms of per capita income, the demographic groups most similar to British are Ethiopian ($46,569, a difference of 0.0%), Serbian ($46,551, a difference of 0.040%), Immigrants from Kuwait ($46,543, a difference of 0.060%), Immigrants from Northern Africa ($46,531, a difference of 0.090%), and Chilean ($46,459, a difference of 0.24%).
| Demographics | Rating | Rank | Per Capita Income |
| Immigrants | Pakistan | 97.9 /100 | #98 | Exceptional $47,084 |
| Laotians | 97.8 /100 | #99 | Exceptional $47,041 |
| Immigrants | Lebanon | 97.5 /100 | #100 | Exceptional $46,938 |
| Immigrants | Uzbekistan | 97.5 /100 | #101 | Exceptional $46,929 |
| Immigrants | Western Asia | 97.4 /100 | #102 | Exceptional $46,876 |
| Syrians | 97.2 /100 | #103 | Exceptional $46,837 |
| Brazilians | 96.8 /100 | #104 | Exceptional $46,700 |
| British | 96.3 /100 | #105 | Exceptional $46,571 |
| Ethiopians | 96.3 /100 | #106 | Exceptional $46,569 |
| Serbians | 96.2 /100 | #107 | Exceptional $46,551 |
| Immigrants | Kuwait | 96.2 /100 | #108 | Exceptional $46,543 |
| Immigrants | Northern Africa | 96.2 /100 | #109 | Exceptional $46,531 |
| Chileans | 95.9 /100 | #110 | Exceptional $46,459 |
| Taiwanese | 95.8 /100 | #111 | Exceptional $46,455 |
| Immigrants | Morocco | 95.7 /100 | #112 | Exceptional $46,430 |