Nicaraguan vs Immigrants from Europe Per Capita Income
COMPARE
Nicaraguan
Immigrants from Europe
Per Capita Income
Per Capita Income Comparison
Nicaraguans
Immigrants from Europe
$39,372
PER CAPITA INCOME
0.8/ 100
METRIC RATING
257th/ 347
METRIC RANK
$50,950
PER CAPITA INCOME
100.0/ 100
METRIC RATING
44th/ 347
METRIC RANK
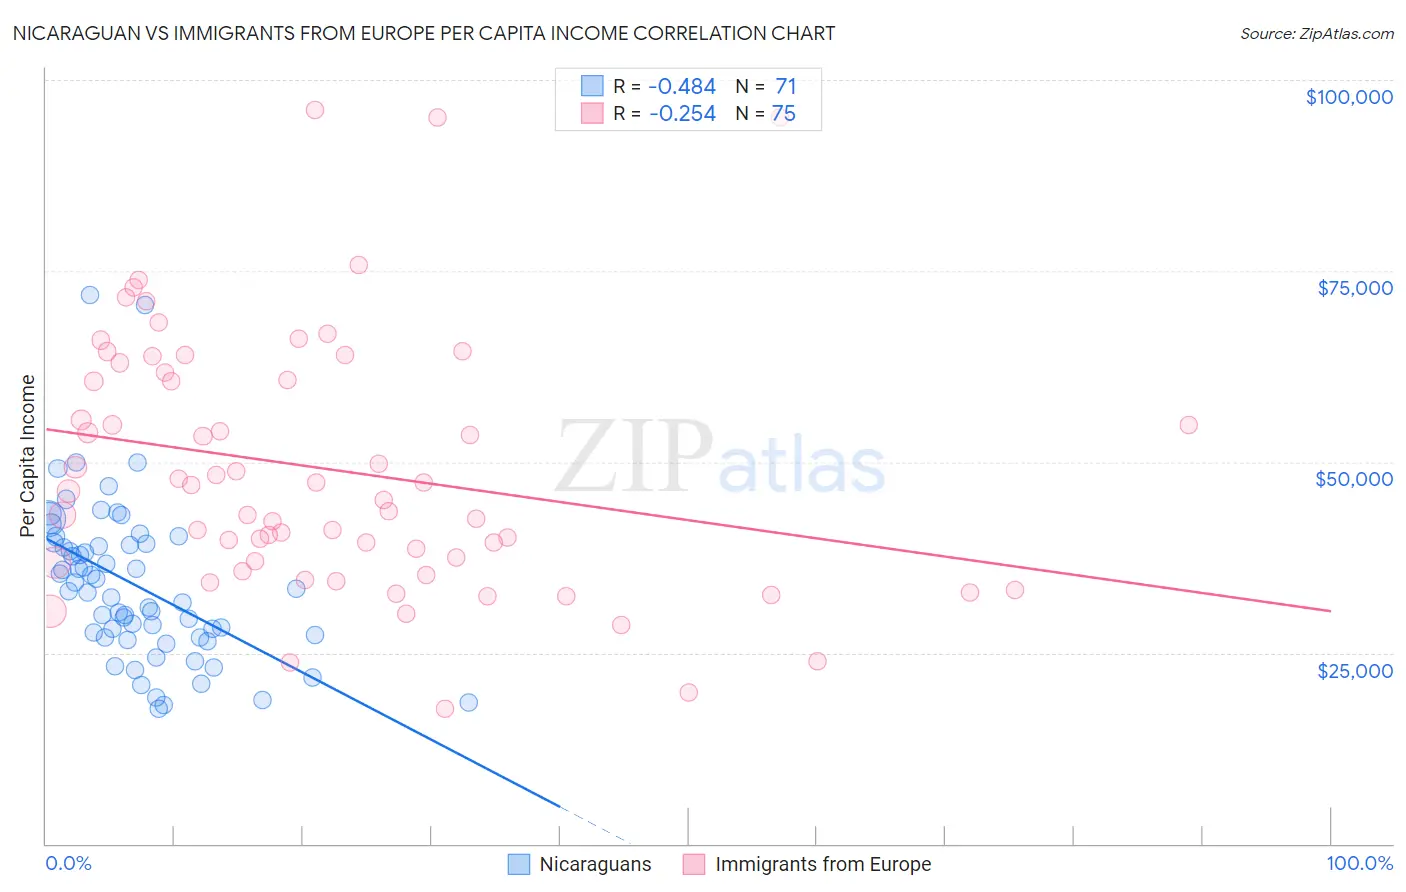
Nicaraguan vs Immigrants from Europe Per Capita Income Correlation Chart
The statistical analysis conducted on geographies consisting of 285,722,062 people shows a moderate negative correlation between the proportion of Nicaraguans and per capita income in the United States with a correlation coefficient (R) of -0.484 and weighted average of $39,372. Similarly, the statistical analysis conducted on geographies consisting of 547,472,676 people shows a weak negative correlation between the proportion of Immigrants from Europe and per capita income in the United States with a correlation coefficient (R) of -0.254 and weighted average of $50,950, a difference of 29.4%.
Per Capita Income Correlation Summary
| Measurement | Nicaraguan | Immigrants from Europe |
| Minimum | $17,623 | $17,669 |
| Maximum | $71,864 | $96,014 |
| Range | $54,241 | $78,345 |
| Mean | $33,908 | $48,981 |
| Median | $33,140 | $46,157 |
| Interquartile 25% (IQ1) | $27,013 | $36,802 |
| Interquartile 75% (IQ3) | $39,273 | $61,703 |
| Interquartile Range (IQR) | $12,260 | $24,901 |
| Standard Deviation (Sample) | $10,352 | $16,839 |
| Standard Deviation (Population) | $10,279 | $16,727 |
Similar Demographics by Per Capita Income
Demographics Similar to Nicaraguans by Per Capita Income
In terms of per capita income, the demographic groups most similar to Nicaraguans are Hawaiian ($39,403, a difference of 0.080%), Jamaican ($39,231, a difference of 0.36%), Immigrants from Middle Africa ($39,529, a difference of 0.40%), Malaysian ($39,194, a difference of 0.46%), and Alaska Native ($39,558, a difference of 0.47%).
| Demographics | Rating | Rank | Per Capita Income |
| Immigrants | Burma/Myanmar | 1.3 /100 | #250 | Tragic $39,827 |
| Samoans | 1.3 /100 | #251 | Tragic $39,826 |
| Immigrants | Azores | 1.0 /100 | #252 | Tragic $39,608 |
| Osage | 1.0 /100 | #253 | Tragic $39,568 |
| Alaska Natives | 1.0 /100 | #254 | Tragic $39,558 |
| Immigrants | Middle Africa | 1.0 /100 | #255 | Tragic $39,529 |
| Hawaiians | 0.8 /100 | #256 | Tragic $39,403 |
| Nicaraguans | 0.8 /100 | #257 | Tragic $39,372 |
| Jamaicans | 0.7 /100 | #258 | Tragic $39,231 |
| Malaysians | 0.7 /100 | #259 | Tragic $39,194 |
| Alaskan Athabascans | 0.6 /100 | #260 | Tragic $39,163 |
| Marshallese | 0.6 /100 | #261 | Tragic $39,108 |
| Iroquois | 0.6 /100 | #262 | Tragic $39,104 |
| Belizeans | 0.6 /100 | #263 | Tragic $39,097 |
| Americans | 0.6 /100 | #264 | Tragic $39,039 |
Demographics Similar to Immigrants from Europe by Per Capita Income
In terms of per capita income, the demographic groups most similar to Immigrants from Europe are Immigrants from Spain ($50,933, a difference of 0.030%), Immigrants from Latvia ($50,914, a difference of 0.070%), Bulgarian ($50,906, a difference of 0.090%), Immigrants from Serbia ($50,810, a difference of 0.28%), and New Zealander ($50,575, a difference of 0.74%).
| Demographics | Rating | Rank | Per Capita Income |
| Estonians | 100.0 /100 | #37 | Exceptional $51,875 |
| Immigrants | Czechoslovakia | 100.0 /100 | #38 | Exceptional $51,770 |
| Cambodians | 100.0 /100 | #39 | Exceptional $51,731 |
| Immigrants | Korea | 100.0 /100 | #40 | Exceptional $51,671 |
| Immigrants | South Africa | 100.0 /100 | #41 | Exceptional $51,465 |
| Immigrants | Turkey | 100.0 /100 | #42 | Exceptional $51,368 |
| Immigrants | Lithuania | 100.0 /100 | #43 | Exceptional $51,361 |
| Immigrants | Europe | 100.0 /100 | #44 | Exceptional $50,950 |
| Immigrants | Spain | 100.0 /100 | #45 | Exceptional $50,933 |
| Immigrants | Latvia | 100.0 /100 | #46 | Exceptional $50,914 |
| Bulgarians | 100.0 /100 | #47 | Exceptional $50,906 |
| Immigrants | Serbia | 100.0 /100 | #48 | Exceptional $50,810 |
| New Zealanders | 100.0 /100 | #49 | Exceptional $50,575 |
| Immigrants | Sri Lanka | 100.0 /100 | #50 | Exceptional $50,555 |
| Immigrants | Netherlands | 100.0 /100 | #51 | Exceptional $50,458 |