Serbian vs Tohono O'odham Per Capita Income
COMPARE
Serbian
Tohono O'odham
Per Capita Income
Per Capita Income Comparison
Serbians
Tohono O'odham
$46,551
PER CAPITA INCOME
96.2/ 100
METRIC RATING
107th/ 347
METRIC RANK
$30,256
PER CAPITA INCOME
0.0/ 100
METRIC RATING
345th/ 347
METRIC RANK
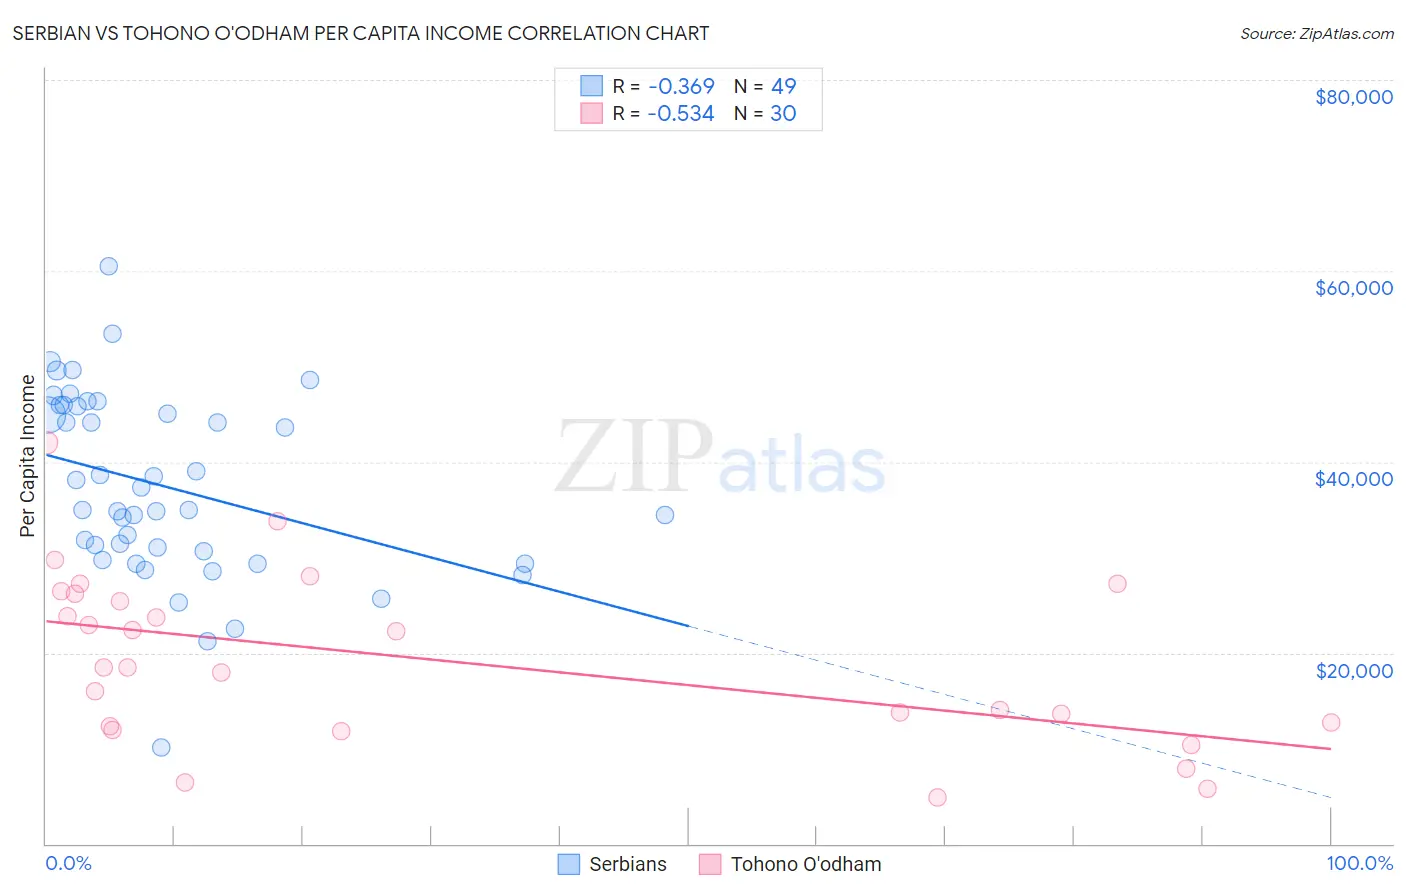
Serbian vs Tohono O'odham Per Capita Income Correlation Chart
The statistical analysis conducted on geographies consisting of 267,655,306 people shows a mild negative correlation between the proportion of Serbians and per capita income in the United States with a correlation coefficient (R) of -0.369 and weighted average of $46,551. Similarly, the statistical analysis conducted on geographies consisting of 58,730,368 people shows a substantial negative correlation between the proportion of Tohono O'odham and per capita income in the United States with a correlation coefficient (R) of -0.534 and weighted average of $30,256, a difference of 53.9%.
Per Capita Income Correlation Summary
| Measurement | Serbian | Tohono O'odham |
| Minimum | $10,108 | $4,874 |
| Maximum | $60,445 | $41,987 |
| Range | $50,337 | $37,113 |
| Mean | $37,423 | $19,246 |
| Median | $35,016 | $18,448 |
| Interquartile 25% (IQ1) | $30,161 | $12,324 |
| Interquartile 75% (IQ3) | $45,911 | $26,227 |
| Interquartile Range (IQR) | $15,749 | $13,903 |
| Standard Deviation (Sample) | $9,694 | $8,934 |
| Standard Deviation (Population) | $9,595 | $8,784 |
Similar Demographics by Per Capita Income
Demographics Similar to Serbians by Per Capita Income
In terms of per capita income, the demographic groups most similar to Serbians are Immigrants from Kuwait ($46,543, a difference of 0.020%), British ($46,571, a difference of 0.040%), Ethiopian ($46,569, a difference of 0.040%), Immigrants from Northern Africa ($46,531, a difference of 0.040%), and Chilean ($46,459, a difference of 0.20%).
| Demographics | Rating | Rank | Per Capita Income |
| Immigrants | Lebanon | 97.5 /100 | #100 | Exceptional $46,938 |
| Immigrants | Uzbekistan | 97.5 /100 | #101 | Exceptional $46,929 |
| Immigrants | Western Asia | 97.4 /100 | #102 | Exceptional $46,876 |
| Syrians | 97.2 /100 | #103 | Exceptional $46,837 |
| Brazilians | 96.8 /100 | #104 | Exceptional $46,700 |
| British | 96.3 /100 | #105 | Exceptional $46,571 |
| Ethiopians | 96.3 /100 | #106 | Exceptional $46,569 |
| Serbians | 96.2 /100 | #107 | Exceptional $46,551 |
| Immigrants | Kuwait | 96.2 /100 | #108 | Exceptional $46,543 |
| Immigrants | Northern Africa | 96.2 /100 | #109 | Exceptional $46,531 |
| Chileans | 95.9 /100 | #110 | Exceptional $46,459 |
| Taiwanese | 95.8 /100 | #111 | Exceptional $46,455 |
| Immigrants | Morocco | 95.7 /100 | #112 | Exceptional $46,430 |
| Immigrants | Albania | 95.5 /100 | #113 | Exceptional $46,387 |
| Afghans | 94.9 /100 | #114 | Exceptional $46,268 |
Demographics Similar to Tohono O'odham by Per Capita Income
In terms of per capita income, the demographic groups most similar to Tohono O'odham are Yup'ik ($30,518, a difference of 0.87%), Pima ($30,644, a difference of 1.3%), Lumbee ($29,845, a difference of 1.4%), Hopi ($31,177, a difference of 3.0%), and Puerto Rican ($31,268, a difference of 3.4%).
| Demographics | Rating | Rank | Per Capita Income |
| Immigrants | Yemen | 0.0 /100 | #333 | Tragic $33,696 |
| Natives/Alaskans | 0.0 /100 | #334 | Tragic $33,279 |
| Yuman | 0.0 /100 | #335 | Tragic $33,236 |
| Yakama | 0.0 /100 | #336 | Tragic $33,009 |
| Houma | 0.0 /100 | #337 | Tragic $32,996 |
| Arapaho | 0.0 /100 | #338 | Tragic $32,345 |
| Pueblo | 0.0 /100 | #339 | Tragic $32,012 |
| Crow | 0.0 /100 | #340 | Tragic $31,729 |
| Puerto Ricans | 0.0 /100 | #341 | Tragic $31,268 |
| Hopi | 0.0 /100 | #342 | Tragic $31,177 |
| Pima | 0.0 /100 | #343 | Tragic $30,644 |
| Yup'ik | 0.0 /100 | #344 | Tragic $30,518 |
| Tohono O'odham | 0.0 /100 | #345 | Tragic $30,256 |
| Lumbee | 0.0 /100 | #346 | Tragic $29,845 |
| Navajo | 0.0 /100 | #347 | Tragic $29,031 |