Serbian vs Polish Bachelor's Degree
COMPARE
Serbian
Polish
Bachelor's Degree
Bachelor's Degree Comparison
Serbians
Poles
40.1%
BACHELOR'S DEGREE
92.4/ 100
METRIC RATING
129th/ 347
METRIC RANK
39.1%
BACHELOR'S DEGREE
79.8/ 100
METRIC RATING
143rd/ 347
METRIC RANK
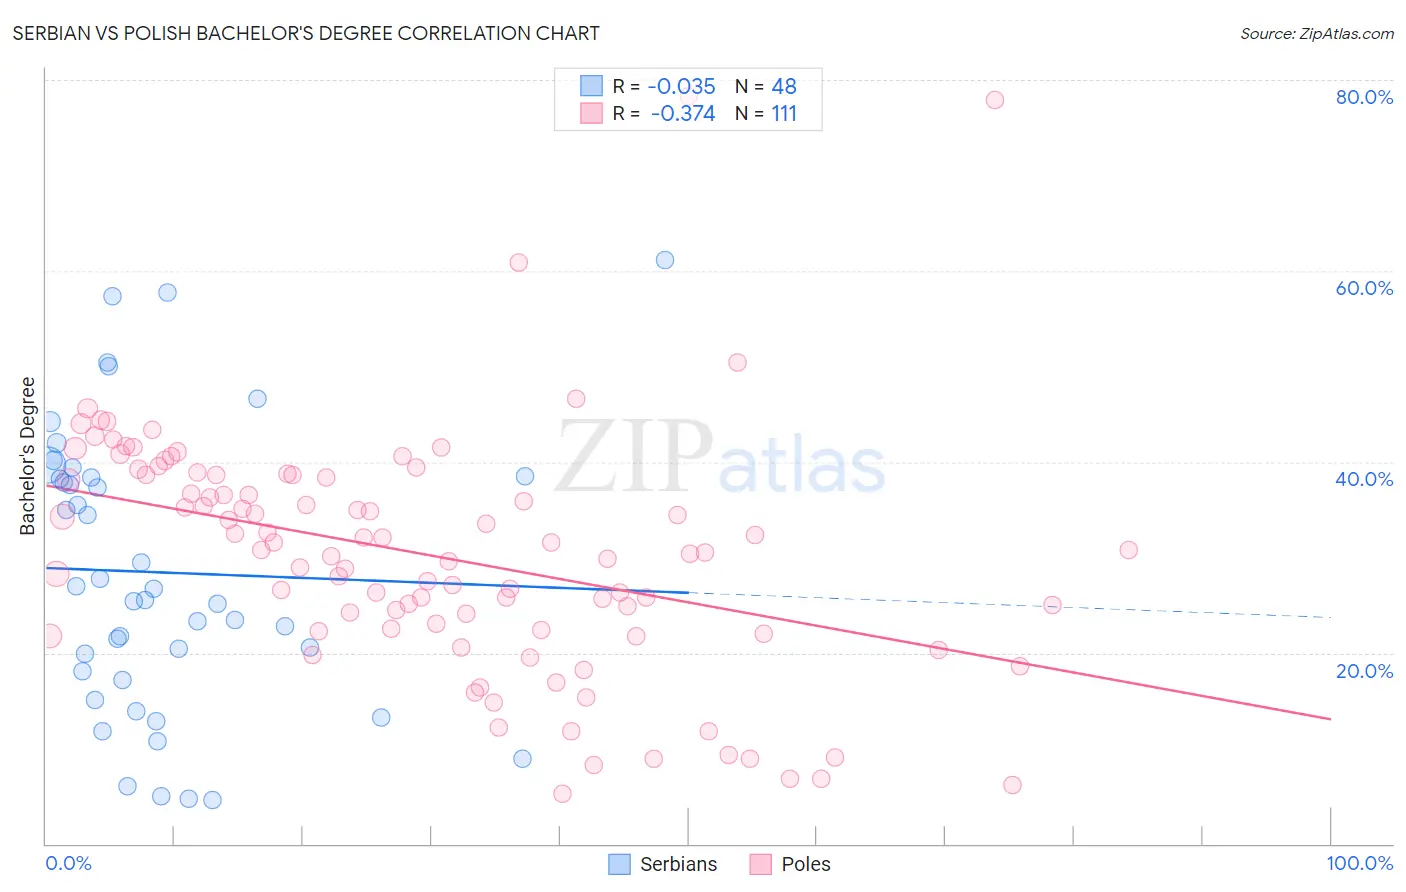
Serbian vs Polish Bachelor's Degree Correlation Chart
The statistical analysis conducted on geographies consisting of 267,632,791 people shows no correlation between the proportion of Serbians and percentage of population with at least bachelor's degree education in the United States with a correlation coefficient (R) of -0.035 and weighted average of 40.1%. Similarly, the statistical analysis conducted on geographies consisting of 560,456,135 people shows a mild negative correlation between the proportion of Poles and percentage of population with at least bachelor's degree education in the United States with a correlation coefficient (R) of -0.374 and weighted average of 39.1%, a difference of 2.6%.
Bachelor's Degree Correlation Summary
| Measurement | Serbian | Polish |
| Minimum | 4.6% | 5.2% |
| Maximum | 61.2% | 78.3% |
| Range | 56.6% | 73.0% |
| Mean | 28.4% | 30.3% |
| Median | 26.1% | 30.7% |
| Interquartile 25% (IQ1) | 17.6% | 22.4% |
| Interquartile 75% (IQ3) | 38.4% | 38.7% |
| Interquartile Range (IQR) | 20.8% | 16.3% |
| Standard Deviation (Sample) | 14.7% | 12.7% |
| Standard Deviation (Population) | 14.6% | 12.7% |
Demographics Similar to Serbians and Poles by Bachelor's Degree
In terms of bachelor's degree, the demographic groups most similar to Serbians are Sierra Leonean (40.1%, a difference of 0.070%), Italian (40.1%, a difference of 0.15%), Immigrants from Venezuela (40.2%, a difference of 0.17%), Immigrants from Jordan (40.3%, a difference of 0.35%), and Taiwanese (40.0%, a difference of 0.40%). Similarly, the demographic groups most similar to Poles are Immigrants from Afghanistan (39.1%, a difference of 0.020%), Slovene (39.1%, a difference of 0.050%), Swedish (39.1%, a difference of 0.090%), Immigrants from North Macedonia (39.2%, a difference of 0.27%), and South American Indian (39.3%, a difference of 0.60%).
| Demographics | Rating | Rank | Bachelor's Degree |
| Immigrants | Eastern Africa | 94.1 /100 | #126 | Exceptional 40.4% |
| Immigrants | Jordan | 93.4 /100 | #127 | Exceptional 40.3% |
| Immigrants | Venezuela | 92.9 /100 | #128 | Exceptional 40.2% |
| Serbians | 92.4 /100 | #129 | Exceptional 40.1% |
| Sierra Leoneans | 92.2 /100 | #130 | Exceptional 40.1% |
| Italians | 91.9 /100 | #131 | Exceptional 40.1% |
| Taiwanese | 91.1 /100 | #132 | Exceptional 40.0% |
| Immigrants | Southern Europe | 91.1 /100 | #133 | Exceptional 40.0% |
| Assyrians/Chaldeans/Syriacs | 89.4 /100 | #134 | Excellent 39.8% |
| Luxembourgers | 89.1 /100 | #135 | Excellent 39.8% |
| Pakistanis | 88.2 /100 | #136 | Excellent 39.7% |
| Icelanders | 86.5 /100 | #137 | Excellent 39.5% |
| Europeans | 85.6 /100 | #138 | Excellent 39.5% |
| Immigrants | Sudan | 84.5 /100 | #139 | Excellent 39.4% |
| Immigrants | Armenia | 84.1 /100 | #140 | Excellent 39.4% |
| South American Indians | 83.6 /100 | #141 | Excellent 39.3% |
| Immigrants | North Macedonia | 81.6 /100 | #142 | Excellent 39.2% |
| Poles | 79.8 /100 | #143 | Good 39.1% |
| Immigrants | Afghanistan | 79.7 /100 | #144 | Good 39.1% |
| Slovenes | 79.5 /100 | #145 | Good 39.1% |
| Swedes | 79.2 /100 | #146 | Good 39.1% |