Serbian vs Immigrants from Japan Median Male Earnings
COMPARE
Serbian
Immigrants from Japan
Median Male Earnings
Median Male Earnings Comparison
Serbians
Immigrants from Japan
$57,975
MEDIAN MALE EARNINGS
96.8/ 100
METRIC RATING
107th/ 347
METRIC RANK
$65,518
MEDIAN MALE EARNINGS
100.0/ 100
METRIC RATING
20th/ 347
METRIC RANK
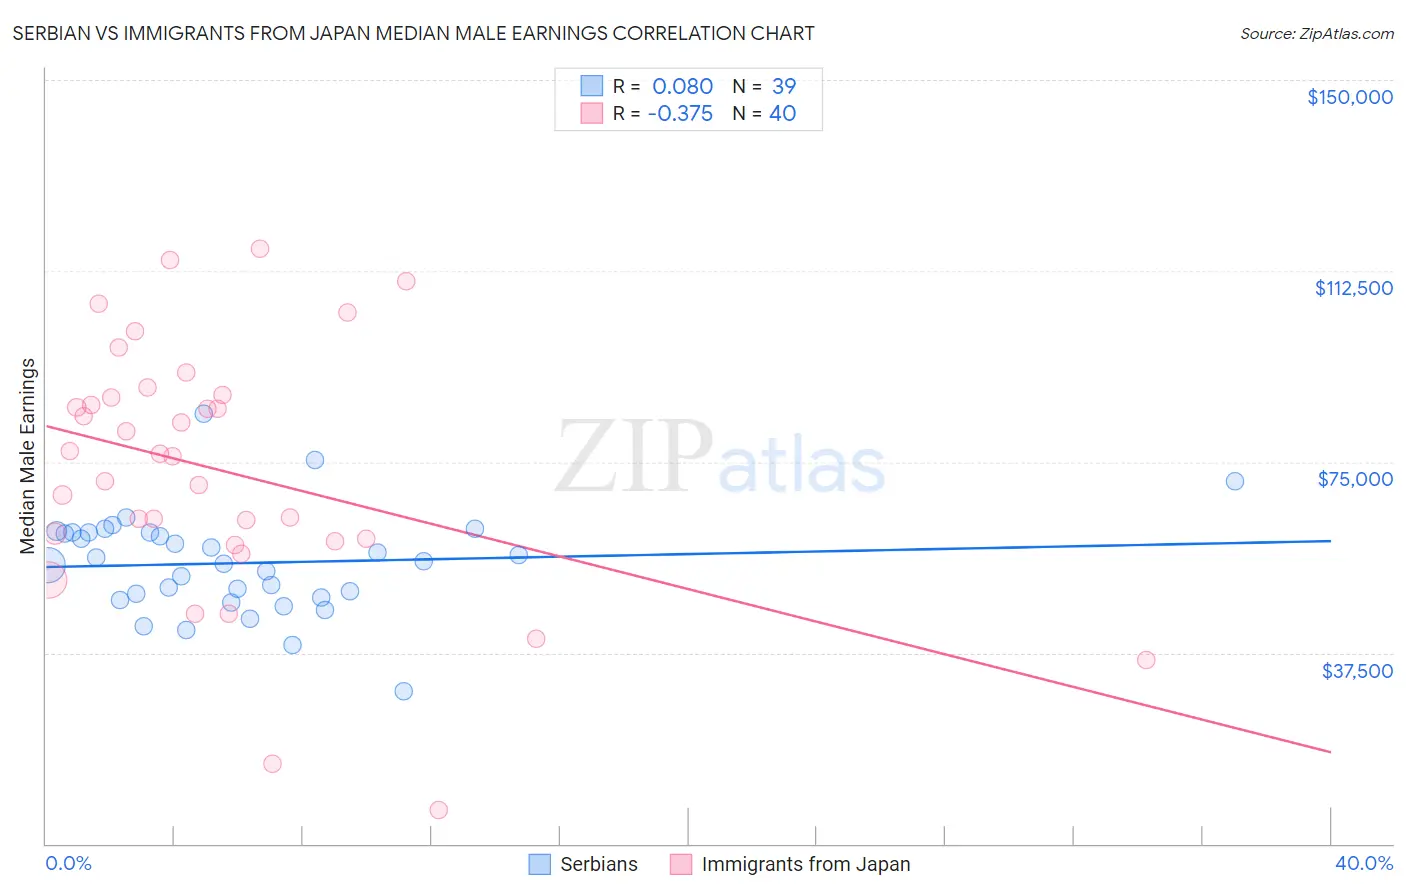
Serbian vs Immigrants from Japan Median Male Earnings Correlation Chart
The statistical analysis conducted on geographies consisting of 267,612,597 people shows a slight positive correlation between the proportion of Serbians and median male earnings in the United States with a correlation coefficient (R) of 0.080 and weighted average of $57,975. Similarly, the statistical analysis conducted on geographies consisting of 340,085,326 people shows a mild negative correlation between the proportion of Immigrants from Japan and median male earnings in the United States with a correlation coefficient (R) of -0.375 and weighted average of $65,518, a difference of 13.0%.
Median Male Earnings Correlation Summary
| Measurement | Serbian | Immigrants from Japan |
| Minimum | $29,881 | $6,550 |
| Maximum | $84,510 | $116,935 |
| Range | $54,629 | $110,385 |
| Mean | $55,134 | $73,268 |
| Median | $55,532 | $76,382 |
| Interquartile 25% (IQ1) | $48,361 | $59,676 |
| Interquartile 75% (IQ3) | $61,216 | $87,930 |
| Interquartile Range (IQR) | $12,855 | $28,253 |
| Standard Deviation (Sample) | $10,037 | $24,811 |
| Standard Deviation (Population) | $9,908 | $24,499 |
Similar Demographics by Median Male Earnings
Demographics Similar to Serbians by Median Male Earnings
In terms of median male earnings, the demographic groups most similar to Serbians are Immigrants from Northern Africa ($58,008, a difference of 0.060%), Immigrants from Uzbekistan ($57,941, a difference of 0.060%), British ($57,890, a difference of 0.15%), Armenian ($58,134, a difference of 0.27%), and Immigrants from Western Asia ($58,131, a difference of 0.27%).
| Demographics | Rating | Rank | Median Male Earnings |
| Assyrians/Chaldeans/Syriacs | 97.9 /100 | #100 | Exceptional $58,437 |
| Immigrants | Brazil | 97.7 /100 | #101 | Exceptional $58,324 |
| Syrians | 97.4 /100 | #102 | Exceptional $58,187 |
| Poles | 97.3 /100 | #103 | Exceptional $58,139 |
| Armenians | 97.3 /100 | #104 | Exceptional $58,134 |
| Immigrants | Western Asia | 97.3 /100 | #105 | Exceptional $58,131 |
| Immigrants | Northern Africa | 96.9 /100 | #106 | Exceptional $58,008 |
| Serbians | 96.8 /100 | #107 | Exceptional $57,975 |
| Immigrants | Uzbekistan | 96.7 /100 | #108 | Exceptional $57,941 |
| British | 96.5 /100 | #109 | Exceptional $57,890 |
| Palestinians | 96.2 /100 | #110 | Exceptional $57,778 |
| Europeans | 95.6 /100 | #111 | Exceptional $57,637 |
| Immigrants | Afghanistan | 95.4 /100 | #112 | Exceptional $57,582 |
| Carpatho Rusyns | 95.3 /100 | #113 | Exceptional $57,572 |
| Immigrants | Kuwait | 95.3 /100 | #114 | Exceptional $57,562 |
Demographics Similar to Immigrants from Japan by Median Male Earnings
In terms of median male earnings, the demographic groups most similar to Immigrants from Japan are Cypriot ($65,549, a difference of 0.050%), Immigrants from Sweden ($65,406, a difference of 0.17%), Burmese ($65,236, a difference of 0.43%), Immigrants from Korea ($65,079, a difference of 0.67%), and Immigrants from Northern Europe ($64,987, a difference of 0.82%).
| Demographics | Rating | Rank | Median Male Earnings |
| Immigrants | China | 100.0 /100 | #13 | Exceptional $67,353 |
| Okinawans | 100.0 /100 | #14 | Exceptional $67,232 |
| Immigrants | Eastern Asia | 100.0 /100 | #15 | Exceptional $66,903 |
| Eastern Europeans | 100.0 /100 | #16 | Exceptional $66,472 |
| Immigrants | Belgium | 100.0 /100 | #17 | Exceptional $66,125 |
| Indians (Asian) | 100.0 /100 | #18 | Exceptional $66,078 |
| Cypriots | 100.0 /100 | #19 | Exceptional $65,549 |
| Immigrants | Japan | 100.0 /100 | #20 | Exceptional $65,518 |
| Immigrants | Sweden | 100.0 /100 | #21 | Exceptional $65,406 |
| Burmese | 100.0 /100 | #22 | Exceptional $65,236 |
| Immigrants | Korea | 100.0 /100 | #23 | Exceptional $65,079 |
| Immigrants | Northern Europe | 100.0 /100 | #24 | Exceptional $64,987 |
| Immigrants | Denmark | 100.0 /100 | #25 | Exceptional $64,625 |
| Turks | 100.0 /100 | #26 | Exceptional $64,253 |
| Immigrants | Switzerland | 100.0 /100 | #27 | Exceptional $63,944 |