Iranian vs Immigrants from Japan Median Male Earnings
COMPARE
Iranian
Immigrants from Japan
Median Male Earnings
Median Male Earnings Comparison
Iranians
Immigrants from Japan
$70,648
MEDIAN MALE EARNINGS
100.0/ 100
METRIC RATING
6th/ 347
METRIC RANK
$65,518
MEDIAN MALE EARNINGS
100.0/ 100
METRIC RATING
20th/ 347
METRIC RANK
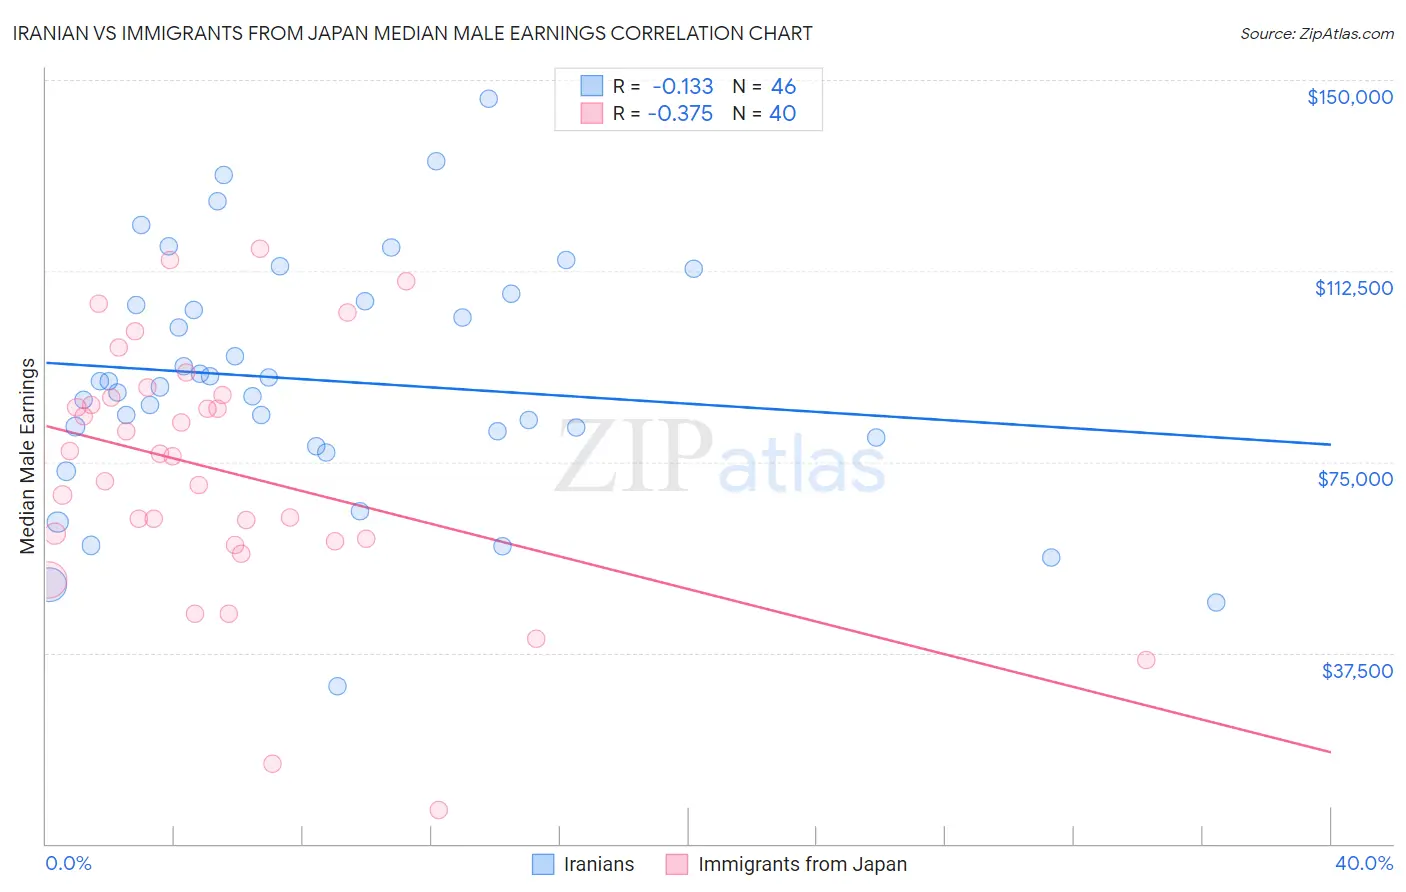
Iranian vs Immigrants from Japan Median Male Earnings Correlation Chart
The statistical analysis conducted on geographies consisting of 316,851,455 people shows a poor negative correlation between the proportion of Iranians and median male earnings in the United States with a correlation coefficient (R) of -0.133 and weighted average of $70,648. Similarly, the statistical analysis conducted on geographies consisting of 340,085,326 people shows a mild negative correlation between the proportion of Immigrants from Japan and median male earnings in the United States with a correlation coefficient (R) of -0.375 and weighted average of $65,518, a difference of 7.8%.
Median Male Earnings Correlation Summary
| Measurement | Iranian | Immigrants from Japan |
| Minimum | $30,816 | $6,550 |
| Maximum | $146,250 | $116,935 |
| Range | $115,434 | $110,385 |
| Mean | $91,002 | $73,268 |
| Median | $90,293 | $76,382 |
| Interquartile 25% (IQ1) | $79,904 | $59,676 |
| Interquartile 75% (IQ3) | $106,492 | $87,930 |
| Interquartile Range (IQR) | $26,588 | $28,253 |
| Standard Deviation (Sample) | $24,044 | $24,811 |
| Standard Deviation (Population) | $23,781 | $24,499 |
Demographics Similar to Iranians and Immigrants from Japan by Median Male Earnings
In terms of median male earnings, the demographic groups most similar to Iranians are Immigrants from Hong Kong ($70,146, a difference of 0.72%), Immigrants from Singapore ($71,348, a difference of 0.99%), Immigrants from Iran ($69,284, a difference of 2.0%), Thai ($72,135, a difference of 2.1%), and Immigrants from South Central Asia ($68,960, a difference of 2.5%). Similarly, the demographic groups most similar to Immigrants from Japan are Cypriot ($65,549, a difference of 0.050%), Immigrants from Sweden ($65,406, a difference of 0.17%), Burmese ($65,236, a difference of 0.43%), Immigrants from Korea ($65,079, a difference of 0.67%), and Indian (Asian) ($66,078, a difference of 0.85%).
| Demographics | Rating | Rank | Median Male Earnings |
| Immigrants | Taiwan | 100.0 /100 | #3 | Exceptional $74,031 |
| Thais | 100.0 /100 | #4 | Exceptional $72,135 |
| Immigrants | Singapore | 100.0 /100 | #5 | Exceptional $71,348 |
| Iranians | 100.0 /100 | #6 | Exceptional $70,648 |
| Immigrants | Hong Kong | 100.0 /100 | #7 | Exceptional $70,146 |
| Immigrants | Iran | 100.0 /100 | #8 | Exceptional $69,284 |
| Immigrants | South Central Asia | 100.0 /100 | #9 | Exceptional $68,960 |
| Immigrants | Israel | 100.0 /100 | #10 | Exceptional $68,716 |
| Immigrants | Ireland | 100.0 /100 | #11 | Exceptional $67,698 |
| Immigrants | Australia | 100.0 /100 | #12 | Exceptional $67,634 |
| Immigrants | China | 100.0 /100 | #13 | Exceptional $67,353 |
| Okinawans | 100.0 /100 | #14 | Exceptional $67,232 |
| Immigrants | Eastern Asia | 100.0 /100 | #15 | Exceptional $66,903 |
| Eastern Europeans | 100.0 /100 | #16 | Exceptional $66,472 |
| Immigrants | Belgium | 100.0 /100 | #17 | Exceptional $66,125 |
| Indians (Asian) | 100.0 /100 | #18 | Exceptional $66,078 |
| Cypriots | 100.0 /100 | #19 | Exceptional $65,549 |
| Immigrants | Japan | 100.0 /100 | #20 | Exceptional $65,518 |
| Immigrants | Sweden | 100.0 /100 | #21 | Exceptional $65,406 |
| Burmese | 100.0 /100 | #22 | Exceptional $65,236 |
| Immigrants | Korea | 100.0 /100 | #23 | Exceptional $65,079 |