Australian vs Immigrants from Japan Median Male Earnings
COMPARE
Australian
Immigrants from Japan
Median Male Earnings
Median Male Earnings Comparison
Australians
Immigrants from Japan
$62,857
MEDIAN MALE EARNINGS
100.0/ 100
METRIC RATING
40th/ 347
METRIC RANK
$65,518
MEDIAN MALE EARNINGS
100.0/ 100
METRIC RATING
20th/ 347
METRIC RANK
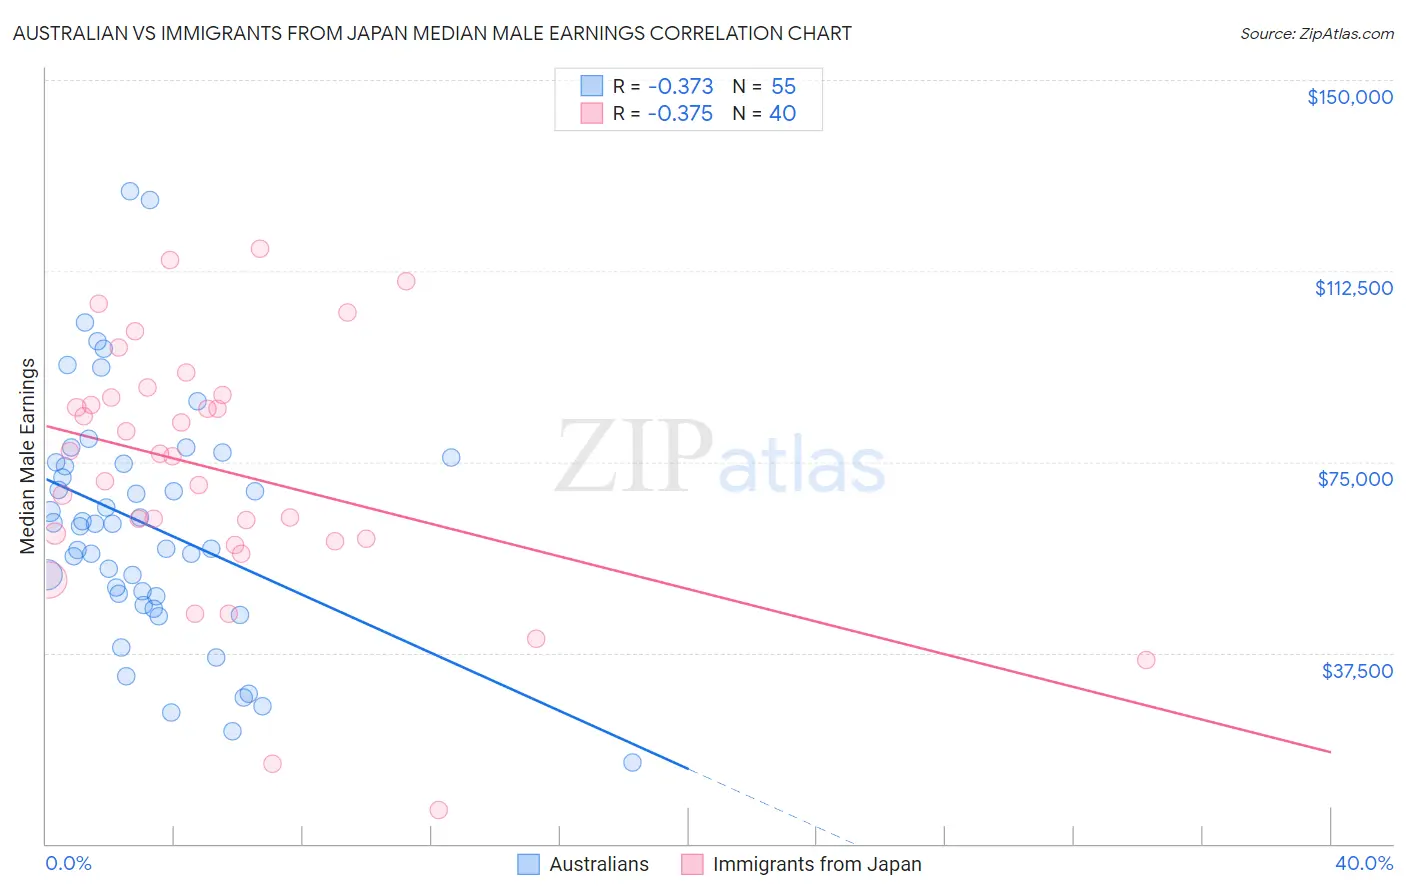
Australian vs Immigrants from Japan Median Male Earnings Correlation Chart
The statistical analysis conducted on geographies consisting of 224,135,609 people shows a mild negative correlation between the proportion of Australians and median male earnings in the United States with a correlation coefficient (R) of -0.373 and weighted average of $62,857. Similarly, the statistical analysis conducted on geographies consisting of 340,085,326 people shows a mild negative correlation between the proportion of Immigrants from Japan and median male earnings in the United States with a correlation coefficient (R) of -0.375 and weighted average of $65,518, a difference of 4.2%.
Median Male Earnings Correlation Summary
| Measurement | Australian | Immigrants from Japan |
| Minimum | $15,945 | $6,550 |
| Maximum | $128,097 | $116,935 |
| Range | $112,152 | $110,385 |
| Mean | $62,501 | $73,268 |
| Median | $62,813 | $76,382 |
| Interquartile 25% (IQ1) | $48,594 | $59,676 |
| Interquartile 75% (IQ3) | $74,900 | $87,930 |
| Interquartile Range (IQR) | $26,306 | $28,253 |
| Standard Deviation (Sample) | $23,536 | $24,811 |
| Standard Deviation (Population) | $23,321 | $24,499 |
Demographics Similar to Australians and Immigrants from Japan by Median Male Earnings
In terms of median male earnings, the demographic groups most similar to Australians are Immigrants from South Africa ($62,899, a difference of 0.070%), Maltese ($62,953, a difference of 0.15%), Immigrants from Sri Lanka ($63,099, a difference of 0.39%), Israeli ($63,228, a difference of 0.59%), and Immigrants from Asia ($63,240, a difference of 0.61%). Similarly, the demographic groups most similar to Immigrants from Japan are Immigrants from Sweden ($65,406, a difference of 0.17%), Burmese ($65,236, a difference of 0.43%), Immigrants from Korea ($65,079, a difference of 0.67%), Immigrants from Northern Europe ($64,987, a difference of 0.82%), and Immigrants from Denmark ($64,625, a difference of 1.4%).
| Demographics | Rating | Rank | Median Male Earnings |
| Immigrants | Japan | 100.0 /100 | #20 | Exceptional $65,518 |
| Immigrants | Sweden | 100.0 /100 | #21 | Exceptional $65,406 |
| Burmese | 100.0 /100 | #22 | Exceptional $65,236 |
| Immigrants | Korea | 100.0 /100 | #23 | Exceptional $65,079 |
| Immigrants | Northern Europe | 100.0 /100 | #24 | Exceptional $64,987 |
| Immigrants | Denmark | 100.0 /100 | #25 | Exceptional $64,625 |
| Turks | 100.0 /100 | #26 | Exceptional $64,253 |
| Immigrants | Switzerland | 100.0 /100 | #27 | Exceptional $63,944 |
| Russians | 100.0 /100 | #28 | Exceptional $63,939 |
| Asians | 100.0 /100 | #29 | Exceptional $63,827 |
| Immigrants | France | 100.0 /100 | #30 | Exceptional $63,715 |
| Latvians | 100.0 /100 | #31 | Exceptional $63,498 |
| Soviet Union | 100.0 /100 | #32 | Exceptional $63,382 |
| Immigrants | Lithuania | 100.0 /100 | #33 | Exceptional $63,346 |
| Immigrants | Russia | 100.0 /100 | #34 | Exceptional $63,326 |
| Immigrants | Asia | 100.0 /100 | #35 | Exceptional $63,240 |
| Israelis | 100.0 /100 | #36 | Exceptional $63,228 |
| Immigrants | Sri Lanka | 100.0 /100 | #37 | Exceptional $63,099 |
| Maltese | 100.0 /100 | #38 | Exceptional $62,953 |
| Immigrants | South Africa | 100.0 /100 | #39 | Exceptional $62,899 |
| Australians | 100.0 /100 | #40 | Exceptional $62,857 |