Filipino vs Immigrants from Japan Median Male Earnings
COMPARE
Filipino
Immigrants from Japan
Median Male Earnings
Median Male Earnings Comparison
Filipinos
Immigrants from Japan
$74,224
MEDIAN MALE EARNINGS
100.0/ 100
METRIC RATING
1st/ 347
METRIC RANK
$65,518
MEDIAN MALE EARNINGS
100.0/ 100
METRIC RATING
20th/ 347
METRIC RANK
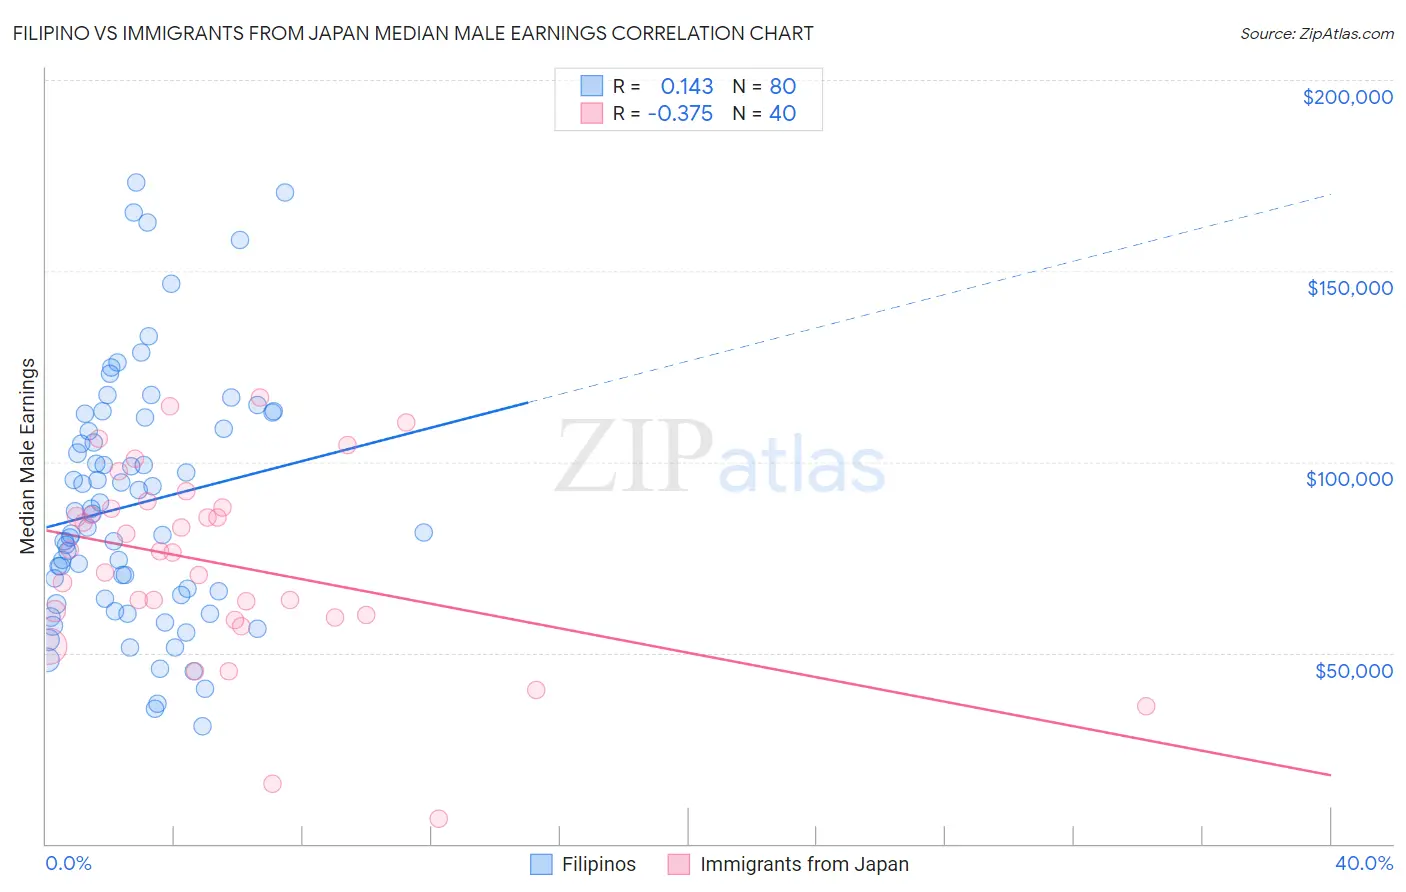
Filipino vs Immigrants from Japan Median Male Earnings Correlation Chart
The statistical analysis conducted on geographies consisting of 254,342,119 people shows a poor positive correlation between the proportion of Filipinos and median male earnings in the United States with a correlation coefficient (R) of 0.143 and weighted average of $74,224. Similarly, the statistical analysis conducted on geographies consisting of 340,085,326 people shows a mild negative correlation between the proportion of Immigrants from Japan and median male earnings in the United States with a correlation coefficient (R) of -0.375 and weighted average of $65,518, a difference of 13.3%.
Median Male Earnings Correlation Summary
| Measurement | Filipino | Immigrants from Japan |
| Minimum | $30,694 | $6,550 |
| Maximum | $173,150 | $116,935 |
| Range | $142,456 | $110,385 |
| Mean | $88,887 | $73,268 |
| Median | $84,592 | $76,382 |
| Interquartile 25% (IQ1) | $64,781 | $59,676 |
| Interquartile 75% (IQ3) | $110,251 | $87,930 |
| Interquartile Range (IQR) | $45,470 | $28,253 |
| Standard Deviation (Sample) | $32,365 | $24,811 |
| Standard Deviation (Population) | $32,162 | $24,499 |
Demographics Similar to Filipinos and Immigrants from Japan by Median Male Earnings
In terms of median male earnings, the demographic groups most similar to Filipinos are Immigrants from India ($74,207, a difference of 0.020%), Immigrants from Taiwan ($74,031, a difference of 0.26%), Thai ($72,135, a difference of 2.9%), Immigrants from Singapore ($71,348, a difference of 4.0%), and Iranian ($70,648, a difference of 5.1%). Similarly, the demographic groups most similar to Immigrants from Japan are Cypriot ($65,549, a difference of 0.050%), Indian (Asian) ($66,078, a difference of 0.85%), Immigrants from Belgium ($66,125, a difference of 0.93%), Eastern European ($66,472, a difference of 1.5%), and Immigrants from Eastern Asia ($66,903, a difference of 2.1%).
| Demographics | Rating | Rank | Median Male Earnings |
| Filipinos | 100.0 /100 | #1 | Exceptional $74,224 |
| Immigrants | India | 100.0 /100 | #2 | Exceptional $74,207 |
| Immigrants | Taiwan | 100.0 /100 | #3 | Exceptional $74,031 |
| Thais | 100.0 /100 | #4 | Exceptional $72,135 |
| Immigrants | Singapore | 100.0 /100 | #5 | Exceptional $71,348 |
| Iranians | 100.0 /100 | #6 | Exceptional $70,648 |
| Immigrants | Hong Kong | 100.0 /100 | #7 | Exceptional $70,146 |
| Immigrants | Iran | 100.0 /100 | #8 | Exceptional $69,284 |
| Immigrants | South Central Asia | 100.0 /100 | #9 | Exceptional $68,960 |
| Immigrants | Israel | 100.0 /100 | #10 | Exceptional $68,716 |
| Immigrants | Ireland | 100.0 /100 | #11 | Exceptional $67,698 |
| Immigrants | Australia | 100.0 /100 | #12 | Exceptional $67,634 |
| Immigrants | China | 100.0 /100 | #13 | Exceptional $67,353 |
| Okinawans | 100.0 /100 | #14 | Exceptional $67,232 |
| Immigrants | Eastern Asia | 100.0 /100 | #15 | Exceptional $66,903 |
| Eastern Europeans | 100.0 /100 | #16 | Exceptional $66,472 |
| Immigrants | Belgium | 100.0 /100 | #17 | Exceptional $66,125 |
| Indians (Asian) | 100.0 /100 | #18 | Exceptional $66,078 |
| Cypriots | 100.0 /100 | #19 | Exceptional $65,549 |
| Immigrants | Japan | 100.0 /100 | #20 | Exceptional $65,518 |