Senegalese vs Immigrants from Cambodia Householder Income Under 25 years
COMPARE
Senegalese
Immigrants from Cambodia
Householder Income Under 25 years
Householder Income Under 25 years Comparison
Senegalese
Immigrants from Cambodia
$48,953
HOUSEHOLDER INCOME UNDER 25 YEARS
0.0/ 100
METRIC RATING
287th/ 347
METRIC RANK
$52,450
HOUSEHOLDER INCOME UNDER 25 YEARS
65.4/ 100
METRIC RATING
162nd/ 347
METRIC RANK
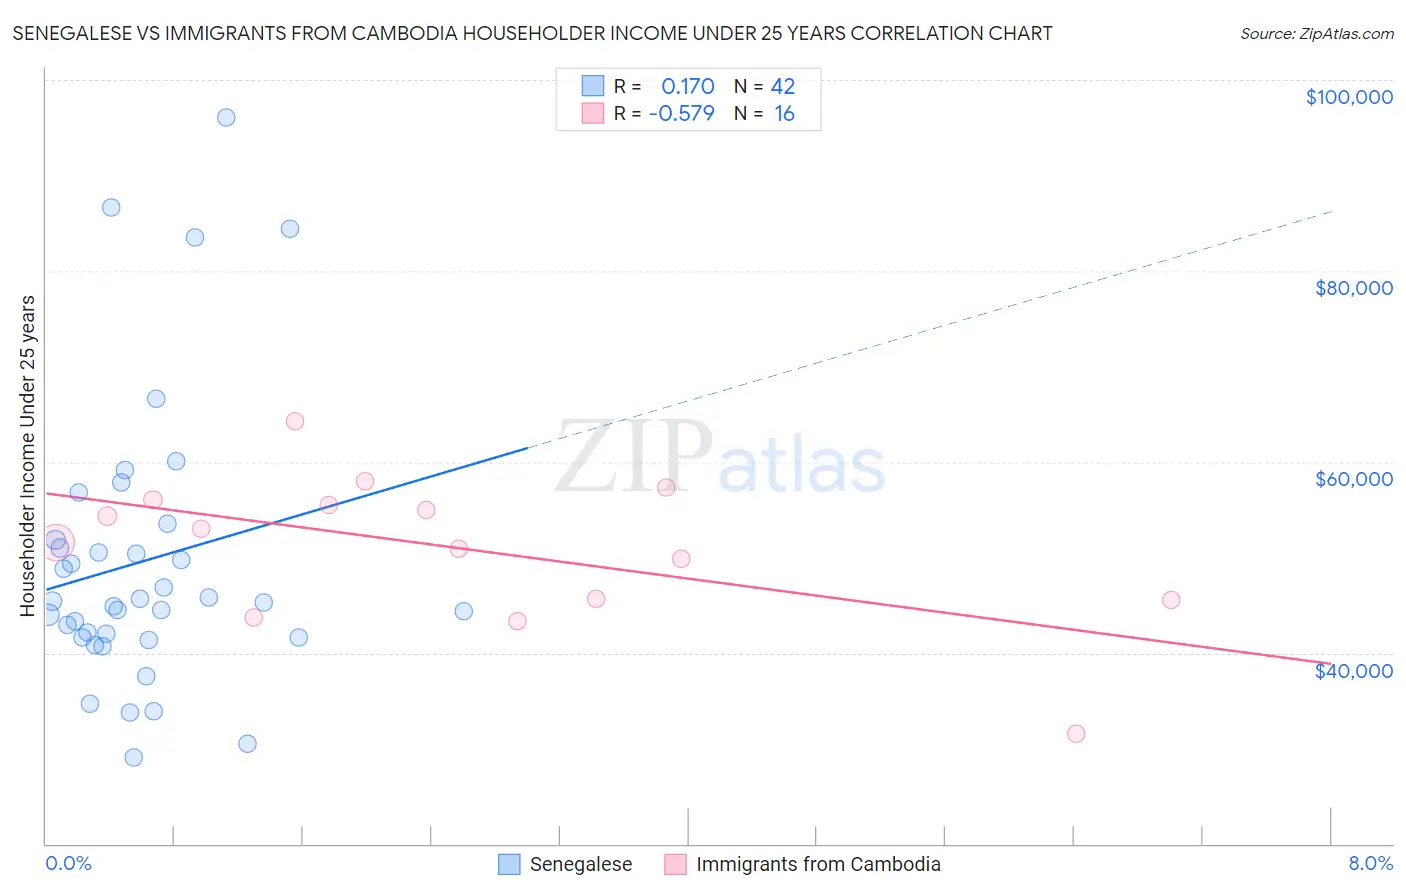
Senegalese vs Immigrants from Cambodia Householder Income Under 25 years Correlation Chart
The statistical analysis conducted on geographies consisting of 74,236,071 people shows a poor positive correlation between the proportion of Senegalese and household income with householder under the age of 25 in the United States with a correlation coefficient (R) of 0.170 and weighted average of $48,953. Similarly, the statistical analysis conducted on geographies consisting of 184,076,569 people shows a substantial negative correlation between the proportion of Immigrants from Cambodia and household income with householder under the age of 25 in the United States with a correlation coefficient (R) of -0.579 and weighted average of $52,450, a difference of 7.1%.
Householder Income Under 25 years Correlation Summary
| Measurement | Senegalese | Immigrants from Cambodia |
| Minimum | $29,051 | $31,569 |
| Maximum | $96,121 | $64,198 |
| Range | $67,070 | $32,629 |
| Mean | $49,594 | $50,948 |
| Median | $45,365 | $52,234 |
| Interquartile 25% (IQ1) | $41,620 | $45,586 |
| Interquartile 75% (IQ3) | $51,815 | $55,713 |
| Interquartile Range (IQR) | $10,195 | $10,127 |
| Standard Deviation (Sample) | $14,774 | $7,692 |
| Standard Deviation (Population) | $14,597 | $7,448 |
Similar Demographics by Householder Income Under 25 years
Demographics Similar to Senegalese by Householder Income Under 25 years
In terms of householder income under 25 years, the demographic groups most similar to Senegalese are French American Indian ($48,977, a difference of 0.050%), Liberian ($48,917, a difference of 0.070%), Honduran ($48,885, a difference of 0.14%), Scotch-Irish ($49,039, a difference of 0.18%), and American ($48,860, a difference of 0.19%).
| Demographics | Rating | Rank | Householder Income Under 25 years |
| Hmong | 0.1 /100 | #280 | Tragic $49,364 |
| Immigrants | Nonimmigrants | 0.1 /100 | #281 | Tragic $49,348 |
| Alsatians | 0.1 /100 | #282 | Tragic $49,267 |
| Immigrants | Nigeria | 0.1 /100 | #283 | Tragic $49,174 |
| Carpatho Rusyns | 0.1 /100 | #284 | Tragic $49,113 |
| Scotch-Irish | 0.0 /100 | #285 | Tragic $49,039 |
| French American Indians | 0.0 /100 | #286 | Tragic $48,977 |
| Senegalese | 0.0 /100 | #287 | Tragic $48,953 |
| Liberians | 0.0 /100 | #288 | Tragic $48,917 |
| Hondurans | 0.0 /100 | #289 | Tragic $48,885 |
| Americans | 0.0 /100 | #290 | Tragic $48,860 |
| Immigrants | Burma/Myanmar | 0.0 /100 | #291 | Tragic $48,749 |
| Shoshone | 0.0 /100 | #292 | Tragic $48,720 |
| Sub-Saharan Africans | 0.0 /100 | #293 | Tragic $48,691 |
| Somalis | 0.0 /100 | #294 | Tragic $48,657 |
Demographics Similar to Immigrants from Cambodia by Householder Income Under 25 years
In terms of householder income under 25 years, the demographic groups most similar to Immigrants from Cambodia are Immigrants from Chile ($52,440, a difference of 0.020%), Uruguayan ($52,465, a difference of 0.030%), Immigrants from Trinidad and Tobago ($52,437, a difference of 0.030%), Polish ($52,407, a difference of 0.080%), and Immigrants from Turkey ($52,503, a difference of 0.10%).
| Demographics | Rating | Rank | Householder Income Under 25 years |
| Immigrants | Denmark | 73.8 /100 | #155 | Good $52,612 |
| Immigrants | Nepal | 73.7 /100 | #156 | Good $52,611 |
| Ghanaians | 72.9 /100 | #157 | Good $52,594 |
| Immigrants | Netherlands | 72.8 /100 | #158 | Good $52,592 |
| Mongolians | 70.2 /100 | #159 | Good $52,540 |
| Immigrants | Turkey | 68.3 /100 | #160 | Good $52,503 |
| Uruguayans | 66.2 /100 | #161 | Good $52,465 |
| Immigrants | Cambodia | 65.4 /100 | #162 | Good $52,450 |
| Immigrants | Chile | 64.8 /100 | #163 | Good $52,440 |
| Immigrants | Trinidad and Tobago | 64.7 /100 | #164 | Good $52,437 |
| Poles | 63.0 /100 | #165 | Good $52,407 |
| Immigrants | Austria | 62.6 /100 | #166 | Good $52,400 |
| Immigrants | Uganda | 61.1 /100 | #167 | Good $52,374 |
| Japanese | 60.5 /100 | #168 | Good $52,365 |
| Canadians | 58.8 /100 | #169 | Average $52,336 |