Serbian vs Immigrants from Honduras Householder Income Under 25 years
COMPARE
Serbian
Immigrants from Honduras
Householder Income Under 25 years
Householder Income Under 25 years Comparison
Serbians
Immigrants from Honduras
$51,106
HOUSEHOLDER INCOME UNDER 25 YEARS
6.6/ 100
METRIC RATING
223rd/ 347
METRIC RANK
$48,267
HOUSEHOLDER INCOME UNDER 25 YEARS
0.0/ 100
METRIC RATING
299th/ 347
METRIC RANK
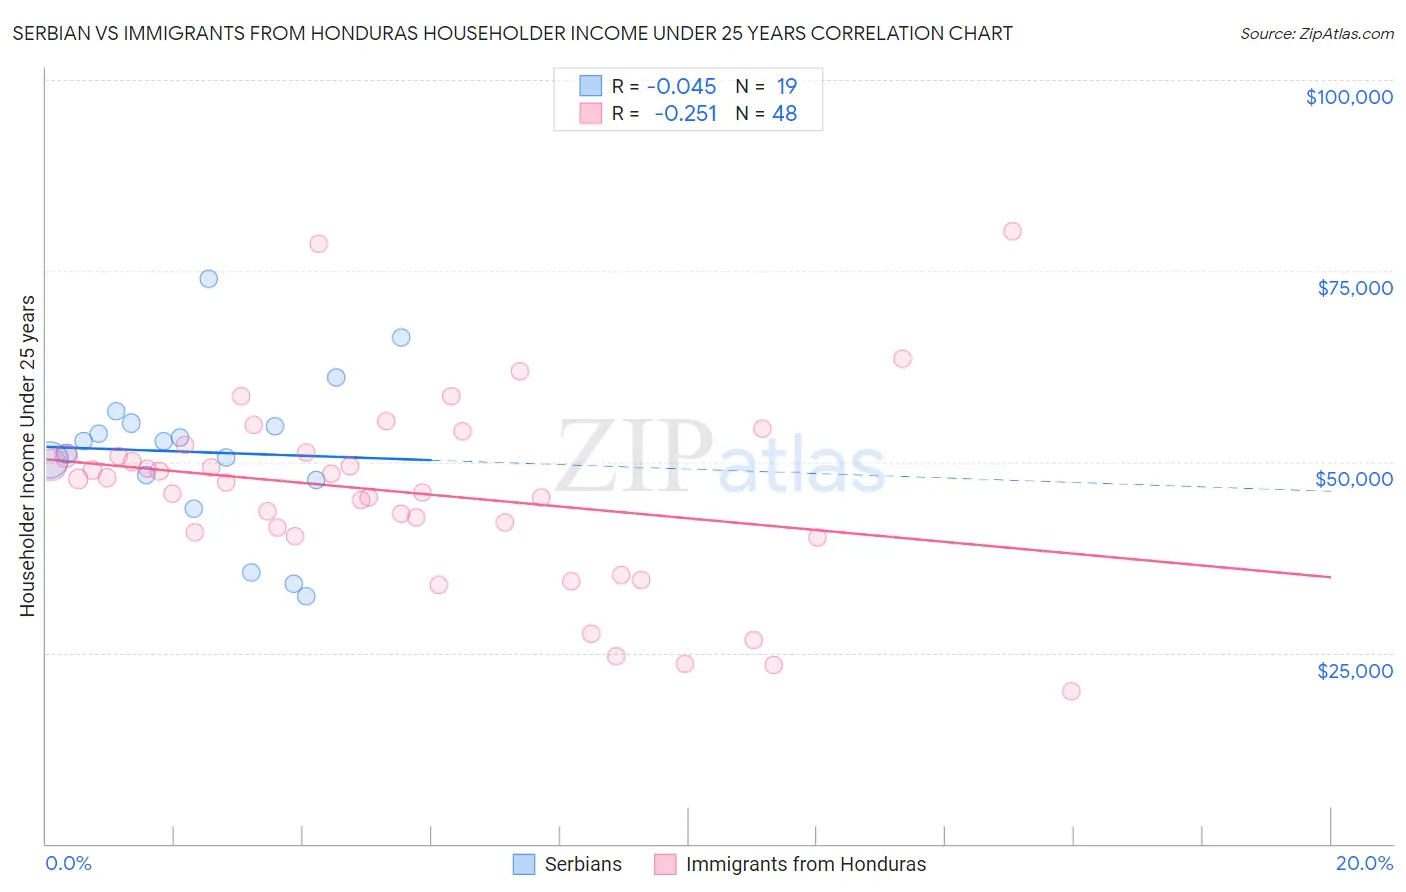
Serbian vs Immigrants from Honduras Householder Income Under 25 years Correlation Chart
The statistical analysis conducted on geographies consisting of 234,162,574 people shows no correlation between the proportion of Serbians and household income with householder under the age of 25 in the United States with a correlation coefficient (R) of -0.045 and weighted average of $51,106. Similarly, the statistical analysis conducted on geographies consisting of 280,925,483 people shows a weak negative correlation between the proportion of Immigrants from Honduras and household income with householder under the age of 25 in the United States with a correlation coefficient (R) of -0.251 and weighted average of $48,267, a difference of 5.9%.
Householder Income Under 25 years Correlation Summary
| Measurement | Serbian | Immigrants from Honduras |
| Minimum | $32,457 | $19,963 |
| Maximum | $73,900 | $80,192 |
| Range | $41,443 | $60,229 |
| Mean | $51,259 | $45,959 |
| Median | $52,630 | $47,527 |
| Interquartile 25% (IQ1) | $47,697 | $40,556 |
| Interquartile 75% (IQ3) | $55,074 | $51,008 |
| Interquartile Range (IQR) | $7,377 | $10,452 |
| Standard Deviation (Sample) | $10,210 | $12,342 |
| Standard Deviation (Population) | $9,937 | $12,213 |
Similar Demographics by Householder Income Under 25 years
Demographics Similar to Serbians by Householder Income Under 25 years
In terms of householder income under 25 years, the demographic groups most similar to Serbians are Spaniard ($51,117, a difference of 0.020%), Belizean ($51,094, a difference of 0.020%), Immigrants from Eastern Africa ($51,158, a difference of 0.10%), Immigrants from Jamaica ($51,038, a difference of 0.13%), and Yugoslavian ($51,028, a difference of 0.15%).
| Demographics | Rating | Rank | Householder Income Under 25 years |
| French | 8.7 /100 | #216 | Tragic $51,230 |
| Czechoslovakians | 8.6 /100 | #217 | Tragic $51,224 |
| Immigrants | Belize | 8.6 /100 | #218 | Tragic $51,223 |
| Arabs | 8.5 /100 | #219 | Tragic $51,219 |
| Immigrants | Germany | 8.0 /100 | #220 | Tragic $51,190 |
| Immigrants | Eastern Africa | 7.4 /100 | #221 | Tragic $51,158 |
| Spaniards | 6.8 /100 | #222 | Tragic $51,117 |
| Serbians | 6.6 /100 | #223 | Tragic $51,106 |
| Belizeans | 6.4 /100 | #224 | Tragic $51,094 |
| Immigrants | Jamaica | 5.6 /100 | #225 | Tragic $51,038 |
| Yugoslavians | 5.5 /100 | #226 | Tragic $51,028 |
| Immigrants | Central America | 5.4 /100 | #227 | Tragic $51,022 |
| Immigrants | Norway | 5.0 /100 | #228 | Tragic $50,984 |
| Yuman | 4.4 /100 | #229 | Tragic $50,933 |
| Jamaicans | 4.4 /100 | #230 | Tragic $50,929 |
Demographics Similar to Immigrants from Honduras by Householder Income Under 25 years
In terms of householder income under 25 years, the demographic groups most similar to Immigrants from Honduras are Yaqui ($48,300, a difference of 0.070%), Immigrants from Somalia ($48,135, a difference of 0.27%), Immigrants from Kuwait ($48,126, a difference of 0.29%), Cree ($48,514, a difference of 0.51%), and Immigrants from Liberia ($47,981, a difference of 0.60%).
| Demographics | Rating | Rank | Householder Income Under 25 years |
| Shoshone | 0.0 /100 | #292 | Tragic $48,720 |
| Sub-Saharan Africans | 0.0 /100 | #293 | Tragic $48,691 |
| Somalis | 0.0 /100 | #294 | Tragic $48,657 |
| Central American Indians | 0.0 /100 | #295 | Tragic $48,643 |
| Blackfeet | 0.0 /100 | #296 | Tragic $48,603 |
| Cree | 0.0 /100 | #297 | Tragic $48,514 |
| Yaqui | 0.0 /100 | #298 | Tragic $48,300 |
| Immigrants | Honduras | 0.0 /100 | #299 | Tragic $48,267 |
| Immigrants | Somalia | 0.0 /100 | #300 | Tragic $48,135 |
| Immigrants | Kuwait | 0.0 /100 | #301 | Tragic $48,126 |
| Immigrants | Liberia | 0.0 /100 | #302 | Tragic $47,981 |
| Immigrants | Middle Africa | 0.0 /100 | #303 | Tragic $47,916 |
| Menominee | 0.0 /100 | #304 | Tragic $47,907 |
| Cherokee | 0.0 /100 | #305 | Tragic $47,848 |
| Natives/Alaskans | 0.0 /100 | #306 | Tragic $47,704 |