Uruguayan vs Mexican Median Female Earnings
COMPARE
Uruguayan
Mexican
Median Female Earnings
Median Female Earnings Comparison
Uruguayans
Mexicans
$39,228
MEDIAN FEMALE EARNINGS
27.3/ 100
METRIC RATING
195th/ 347
METRIC RANK
$33,664
MEDIAN FEMALE EARNINGS
0.0/ 100
METRIC RATING
333rd/ 347
METRIC RANK
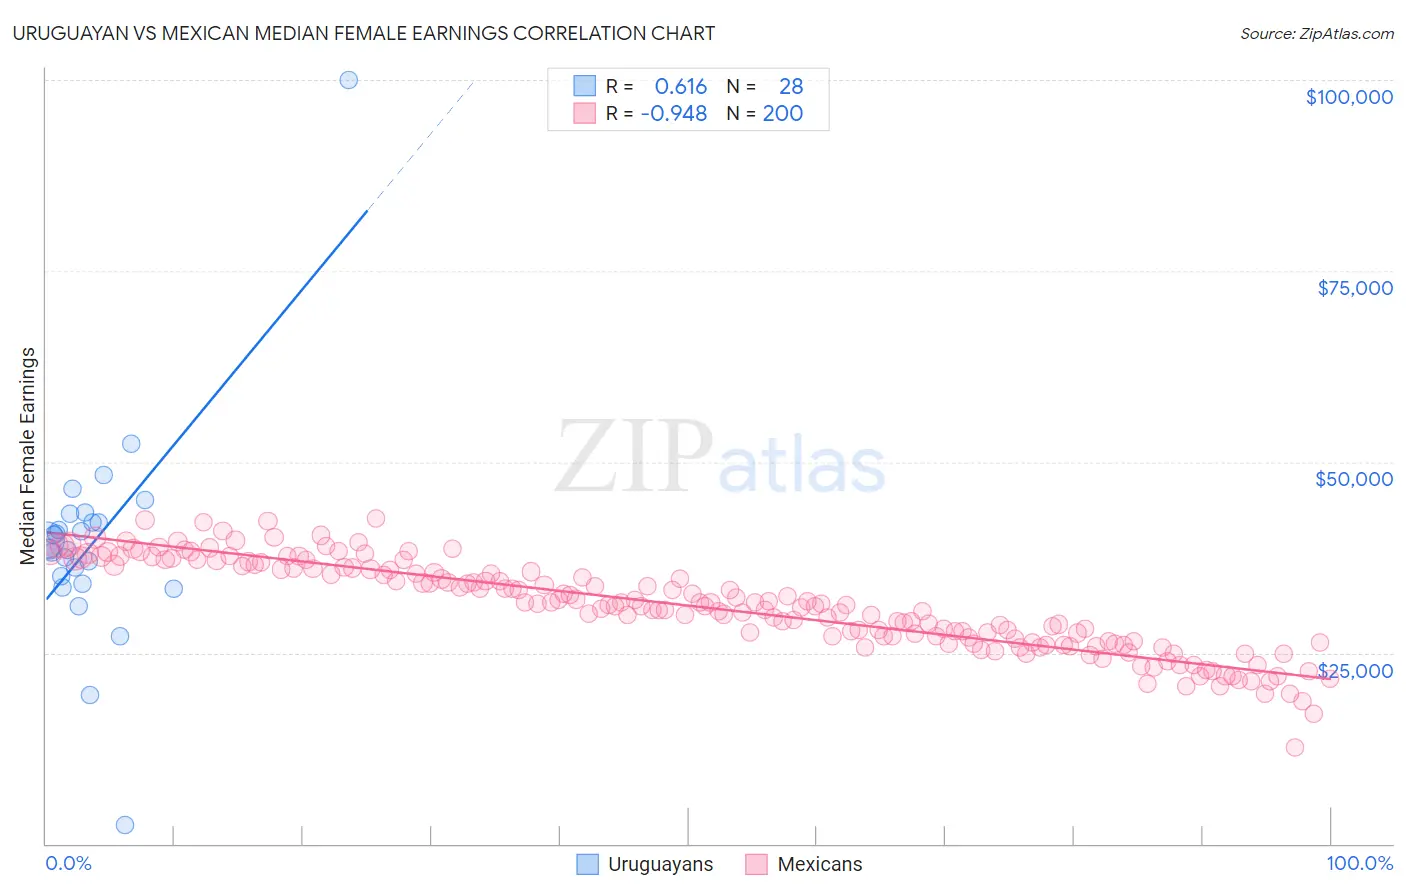
Uruguayan vs Mexican Median Female Earnings Correlation Chart
The statistical analysis conducted on geographies consisting of 144,779,017 people shows a significant positive correlation between the proportion of Uruguayans and median female earnings in the United States with a correlation coefficient (R) of 0.616 and weighted average of $39,228. Similarly, the statistical analysis conducted on geographies consisting of 563,682,270 people shows a near-perfect negative correlation between the proportion of Mexicans and median female earnings in the United States with a correlation coefficient (R) of -0.948 and weighted average of $33,664, a difference of 16.5%.
Median Female Earnings Correlation Summary
| Measurement | Uruguayan | Mexican |
| Minimum | $2,499 | $12,526 |
| Maximum | $100,000 | $42,584 |
| Range | $97,501 | $30,058 |
| Mean | $39,566 | $31,173 |
| Median | $39,168 | $31,351 |
| Interquartile 25% (IQ1) | $34,578 | $26,695 |
| Interquartile 75% (IQ3) | $42,658 | $36,091 |
| Interquartile Range (IQR) | $8,081 | $9,396 |
| Standard Deviation (Sample) | $15,119 | $5,874 |
| Standard Deviation (Population) | $14,847 | $5,859 |
Similar Demographics by Median Female Earnings
Demographics Similar to Uruguayans by Median Female Earnings
In terms of median female earnings, the demographic groups most similar to Uruguayans are Immigrants from Costa Rica ($39,186, a difference of 0.11%), Irish ($39,291, a difference of 0.16%), Immigrants from Nigeria ($39,294, a difference of 0.17%), Assyrian/Chaldean/Syriac ($39,159, a difference of 0.17%), and Immigrants ($39,328, a difference of 0.26%).
| Demographics | Rating | Rank | Median Female Earnings |
| Bermudans | 35.9 /100 | #188 | Fair $39,418 |
| Senegalese | 34.2 /100 | #189 | Fair $39,384 |
| Puget Sound Salish | 33.9 /100 | #190 | Fair $39,376 |
| Immigrants | Western Africa | 32.7 /100 | #191 | Fair $39,351 |
| Immigrants | Immigrants | 31.7 /100 | #192 | Fair $39,328 |
| Immigrants | Nigeria | 30.2 /100 | #193 | Fair $39,294 |
| Irish | 30.0 /100 | #194 | Fair $39,291 |
| Uruguayans | 27.3 /100 | #195 | Fair $39,228 |
| Immigrants | Costa Rica | 25.6 /100 | #196 | Fair $39,186 |
| Assyrians/Chaldeans/Syriacs | 24.6 /100 | #197 | Fair $39,159 |
| Ecuadorians | 23.0 /100 | #198 | Fair $39,117 |
| Icelanders | 22.7 /100 | #199 | Fair $39,109 |
| Immigrants | Panama | 20.6 /100 | #200 | Fair $39,049 |
| Panamanians | 20.6 /100 | #201 | Fair $39,049 |
| Slovaks | 19.9 /100 | #202 | Poor $39,029 |
Demographics Similar to Mexicans by Median Female Earnings
In terms of median female earnings, the demographic groups most similar to Mexicans are Spanish American Indian ($33,625, a difference of 0.12%), Choctaw ($33,775, a difference of 0.33%), Native/Alaskan ($33,806, a difference of 0.42%), Creek ($33,437, a difference of 0.68%), and Menominee ($33,894, a difference of 0.69%).
| Demographics | Rating | Rank | Median Female Earnings |
| Kiowa | 0.0 /100 | #326 | Tragic $34,074 |
| Cajuns | 0.0 /100 | #327 | Tragic $34,034 |
| Immigrants | Central America | 0.0 /100 | #328 | Tragic $33,953 |
| Hopi | 0.0 /100 | #329 | Tragic $33,932 |
| Menominee | 0.0 /100 | #330 | Tragic $33,894 |
| Natives/Alaskans | 0.0 /100 | #331 | Tragic $33,806 |
| Choctaw | 0.0 /100 | #332 | Tragic $33,775 |
| Mexicans | 0.0 /100 | #333 | Tragic $33,664 |
| Spanish American Indians | 0.0 /100 | #334 | Tragic $33,625 |
| Creek | 0.0 /100 | #335 | Tragic $33,437 |
| Ottawa | 0.0 /100 | #336 | Tragic $33,378 |
| Yakama | 0.0 /100 | #337 | Tragic $33,354 |
| Immigrants | Cuba | 0.0 /100 | #338 | Tragic $33,291 |
| Immigrants | Mexico | 0.0 /100 | #339 | Tragic $33,236 |
| Tohono O'odham | 0.0 /100 | #340 | Tragic $33,205 |