Immigrants from North Macedonia vs Immigrants from Kuwait Median Male Earnings
COMPARE
Immigrants from North Macedonia
Immigrants from Kuwait
Median Male Earnings
Median Male Earnings Comparison
Immigrants from North Macedonia
Immigrants from Kuwait
$59,189
MEDIAN MALE EARNINGS
99.0/ 100
METRIC RATING
94th/ 347
METRIC RANK
$57,562
MEDIAN MALE EARNINGS
95.3/ 100
METRIC RATING
114th/ 347
METRIC RANK
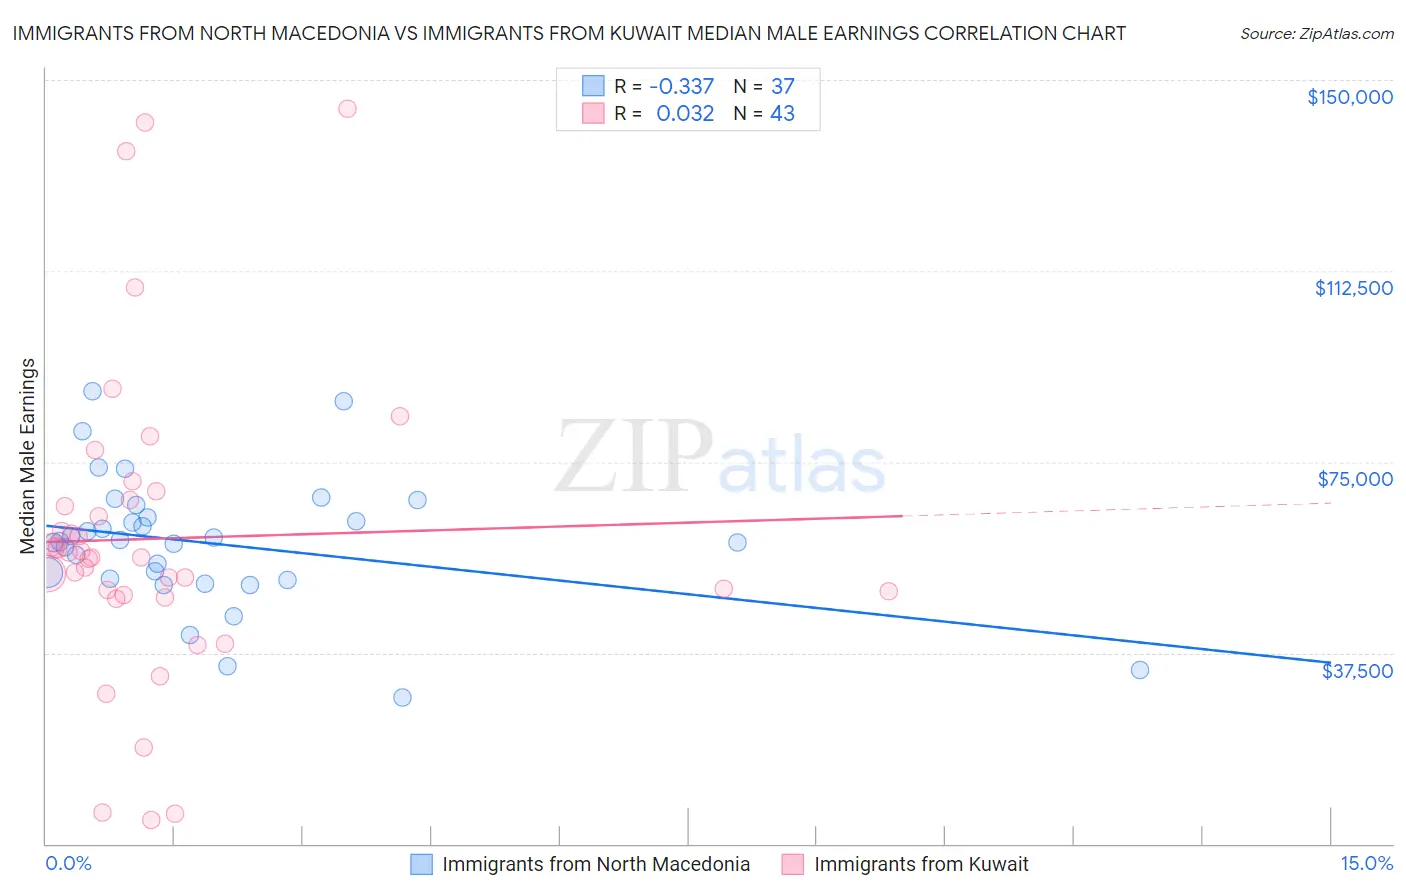
Immigrants from North Macedonia vs Immigrants from Kuwait Median Male Earnings Correlation Chart
The statistical analysis conducted on geographies consisting of 74,299,298 people shows a mild negative correlation between the proportion of Immigrants from North Macedonia and median male earnings in the United States with a correlation coefficient (R) of -0.337 and weighted average of $59,189. Similarly, the statistical analysis conducted on geographies consisting of 136,917,085 people shows no correlation between the proportion of Immigrants from Kuwait and median male earnings in the United States with a correlation coefficient (R) of 0.032 and weighted average of $57,562, a difference of 2.8%.
Median Male Earnings Correlation Summary
| Measurement | Immigrants from North Macedonia | Immigrants from Kuwait |
| Minimum | $28,661 | $4,638 |
| Maximum | $88,807 | $144,236 |
| Range | $60,146 | $139,598 |
| Mean | $58,993 | $59,941 |
| Median | $59,337 | $56,335 |
| Interquartile 25% (IQ1) | $51,864 | $48,946 |
| Interquartile 75% (IQ3) | $65,296 | $67,515 |
| Interquartile Range (IQR) | $13,432 | $18,568 |
| Standard Deviation (Sample) | $12,888 | $30,286 |
| Standard Deviation (Population) | $12,712 | $29,932 |
Demographics Similar to Immigrants from North Macedonia and Immigrants from Kuwait by Median Male Earnings
In terms of median male earnings, the demographic groups most similar to Immigrants from North Macedonia are Immigrants from Lebanon ($58,835, a difference of 0.60%), Albanian ($58,680, a difference of 0.87%), Northern European ($58,588, a difference of 1.0%), Jordanian ($58,500, a difference of 1.2%), and Immigrants from Poland ($58,452, a difference of 1.3%). Similarly, the demographic groups most similar to Immigrants from Kuwait are Carpatho Rusyn ($57,572, a difference of 0.020%), Immigrants from Afghanistan ($57,582, a difference of 0.040%), European ($57,637, a difference of 0.13%), Palestinian ($57,778, a difference of 0.38%), and British ($57,890, a difference of 0.57%).
| Demographics | Rating | Rank | Median Male Earnings |
| Immigrants | North Macedonia | 99.0 /100 | #94 | Exceptional $59,189 |
| Immigrants | Lebanon | 98.6 /100 | #95 | Exceptional $58,835 |
| Albanians | 98.4 /100 | #96 | Exceptional $58,680 |
| Northern Europeans | 98.2 /100 | #97 | Exceptional $58,588 |
| Jordanians | 98.1 /100 | #98 | Exceptional $58,500 |
| Immigrants | Poland | 98.0 /100 | #99 | Exceptional $58,452 |
| Assyrians/Chaldeans/Syriacs | 97.9 /100 | #100 | Exceptional $58,437 |
| Immigrants | Brazil | 97.7 /100 | #101 | Exceptional $58,324 |
| Syrians | 97.4 /100 | #102 | Exceptional $58,187 |
| Poles | 97.3 /100 | #103 | Exceptional $58,139 |
| Armenians | 97.3 /100 | #104 | Exceptional $58,134 |
| Immigrants | Western Asia | 97.3 /100 | #105 | Exceptional $58,131 |
| Immigrants | Northern Africa | 96.9 /100 | #106 | Exceptional $58,008 |
| Serbians | 96.8 /100 | #107 | Exceptional $57,975 |
| Immigrants | Uzbekistan | 96.7 /100 | #108 | Exceptional $57,941 |
| British | 96.5 /100 | #109 | Exceptional $57,890 |
| Palestinians | 96.2 /100 | #110 | Exceptional $57,778 |
| Europeans | 95.6 /100 | #111 | Exceptional $57,637 |
| Immigrants | Afghanistan | 95.4 /100 | #112 | Exceptional $57,582 |
| Carpatho Rusyns | 95.3 /100 | #113 | Exceptional $57,572 |
| Immigrants | Kuwait | 95.3 /100 | #114 | Exceptional $57,562 |