Seminole vs Immigrants from Dominican Republic Per Capita Income
COMPARE
Seminole
Immigrants from Dominican Republic
Per Capita Income
Per Capita Income Comparison
Seminole
Immigrants from Dominican Republic
$36,180
PER CAPITA INCOME
0.0/ 100
METRIC RATING
314th/ 347
METRIC RANK
$37,306
PER CAPITA INCOME
0.1/ 100
METRIC RATING
295th/ 347
METRIC RANK
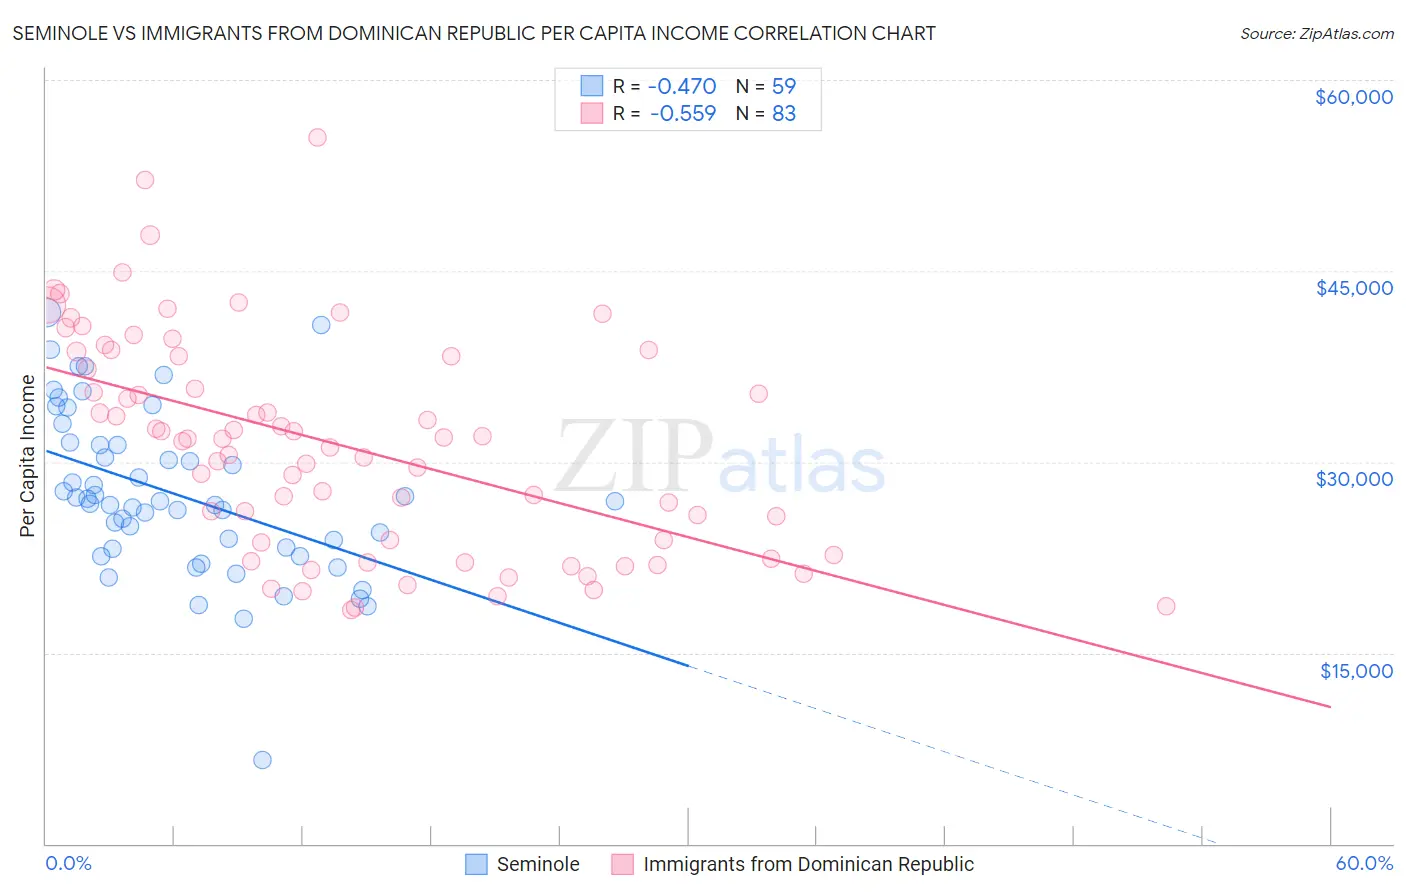
Seminole vs Immigrants from Dominican Republic Per Capita Income Correlation Chart
The statistical analysis conducted on geographies consisting of 118,313,864 people shows a moderate negative correlation between the proportion of Seminole and per capita income in the United States with a correlation coefficient (R) of -0.470 and weighted average of $36,180. Similarly, the statistical analysis conducted on geographies consisting of 275,145,161 people shows a substantial negative correlation between the proportion of Immigrants from Dominican Republic and per capita income in the United States with a correlation coefficient (R) of -0.559 and weighted average of $37,306, a difference of 3.1%.
Per Capita Income Correlation Summary
| Measurement | Seminole | Immigrants from Dominican Republic |
| Minimum | $6,596 | $18,351 |
| Maximum | $41,755 | $55,513 |
| Range | $35,159 | $37,162 |
| Mean | $27,427 | $31,368 |
| Median | $26,891 | $31,841 |
| Interquartile 25% (IQ1) | $23,175 | $23,631 |
| Interquartile 75% (IQ3) | $31,374 | $38,333 |
| Interquartile Range (IQR) | $8,199 | $14,702 |
| Standard Deviation (Sample) | $6,480 | $8,445 |
| Standard Deviation (Population) | $6,425 | $8,394 |
Demographics Similar to Seminole and Immigrants from Dominican Republic by Per Capita Income
In terms of per capita income, the demographic groups most similar to Seminole are Bahamian ($36,427, a difference of 0.68%), Chickasaw ($36,475, a difference of 0.81%), Chippewa ($36,631, a difference of 1.2%), Ute ($36,651, a difference of 1.3%), and Immigrants from Honduras ($36,665, a difference of 1.3%). Similarly, the demographic groups most similar to Immigrants from Dominican Republic are Indonesian ($37,300, a difference of 0.020%), Haitian ($37,289, a difference of 0.040%), Immigrants from Caribbean ($37,254, a difference of 0.14%), Cuban ($37,383, a difference of 0.21%), and Cherokee ($37,203, a difference of 0.27%).
| Demographics | Rating | Rank | Per Capita Income |
| Cubans | 0.1 /100 | #294 | Tragic $37,383 |
| Immigrants | Dominican Republic | 0.1 /100 | #295 | Tragic $37,306 |
| Indonesians | 0.1 /100 | #296 | Tragic $37,300 |
| Haitians | 0.1 /100 | #297 | Tragic $37,289 |
| Immigrants | Caribbean | 0.1 /100 | #298 | Tragic $37,254 |
| Cherokee | 0.1 /100 | #299 | Tragic $37,203 |
| Immigrants | Bahamas | 0.1 /100 | #300 | Tragic $37,193 |
| Ottawa | 0.1 /100 | #301 | Tragic $37,101 |
| Shoshone | 0.1 /100 | #302 | Tragic $37,072 |
| Paiute | 0.1 /100 | #303 | Tragic $37,066 |
| Hondurans | 0.1 /100 | #304 | Tragic $37,031 |
| Inupiat | 0.1 /100 | #305 | Tragic $36,999 |
| Immigrants | Haiti | 0.0 /100 | #306 | Tragic $36,849 |
| Immigrants | Latin America | 0.0 /100 | #307 | Tragic $36,823 |
| Fijians | 0.0 /100 | #308 | Tragic $36,690 |
| Immigrants | Honduras | 0.0 /100 | #309 | Tragic $36,665 |
| Ute | 0.0 /100 | #310 | Tragic $36,651 |
| Chippewa | 0.0 /100 | #311 | Tragic $36,631 |
| Chickasaw | 0.0 /100 | #312 | Tragic $36,475 |
| Bahamians | 0.0 /100 | #313 | Tragic $36,427 |
| Seminole | 0.0 /100 | #314 | Tragic $36,180 |