Scottish vs Immigrants from Eastern Europe Median Male Earnings
COMPARE
Scottish
Immigrants from Eastern Europe
Median Male Earnings
Median Male Earnings Comparison
Scottish
Immigrants from Eastern Europe
$55,793
MEDIAN MALE EARNINGS
78.2/ 100
METRIC RATING
148th/ 347
METRIC RANK
$60,958
MEDIAN MALE EARNINGS
99.8/ 100
METRIC RATING
64th/ 347
METRIC RANK
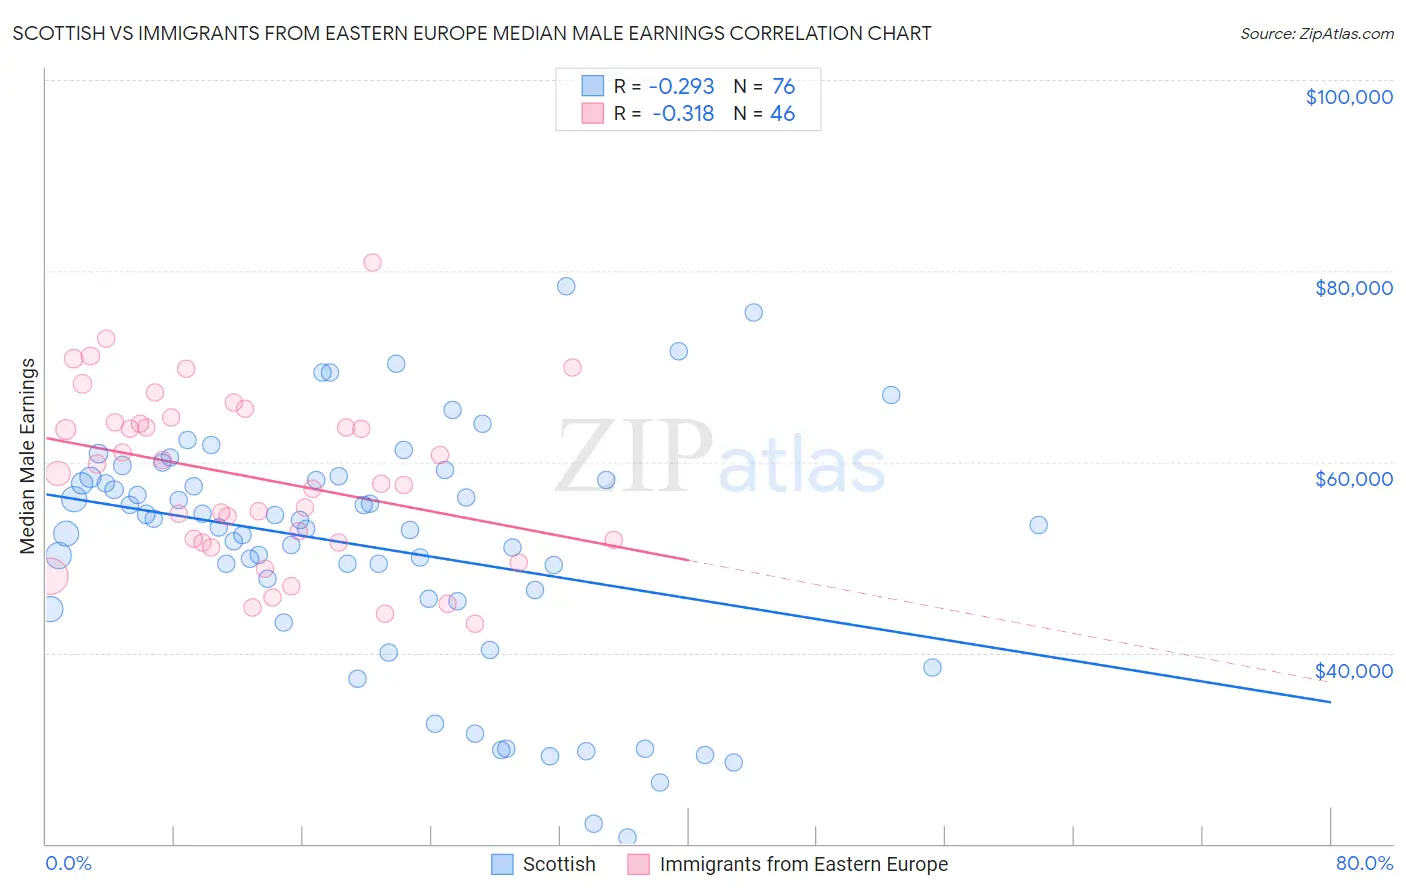
Scottish vs Immigrants from Eastern Europe Median Male Earnings Correlation Chart
The statistical analysis conducted on geographies consisting of 565,821,197 people shows a weak negative correlation between the proportion of Scottish and median male earnings in the United States with a correlation coefficient (R) of -0.293 and weighted average of $55,793. Similarly, the statistical analysis conducted on geographies consisting of 475,591,188 people shows a mild negative correlation between the proportion of Immigrants from Eastern Europe and median male earnings in the United States with a correlation coefficient (R) of -0.318 and weighted average of $60,958, a difference of 9.3%.
Median Male Earnings Correlation Summary
| Measurement | Scottish | Immigrants from Eastern Europe |
| Minimum | $20,625 | $43,003 |
| Maximum | $78,335 | $80,938 |
| Range | $57,710 | $37,935 |
| Mean | $51,052 | $58,399 |
| Median | $53,253 | $58,206 |
| Interquartile 25% (IQ1) | $45,587 | $51,611 |
| Interquartile 75% (IQ3) | $58,253 | $64,157 |
| Interquartile Range (IQR) | $12,667 | $12,547 |
| Standard Deviation (Sample) | $12,626 | $8,866 |
| Standard Deviation (Population) | $12,543 | $8,769 |
Similar Demographics by Median Male Earnings
Demographics Similar to Scottish by Median Male Earnings
In terms of median male earnings, the demographic groups most similar to Scottish are Immigrants from Philippines ($55,809, a difference of 0.030%), English ($55,747, a difference of 0.080%), Swiss ($55,731, a difference of 0.11%), Immigrants from Oceania ($55,712, a difference of 0.15%), and Peruvian ($55,659, a difference of 0.24%).
| Demographics | Rating | Rank | Median Male Earnings |
| Danes | 84.8 /100 | #141 | Excellent $56,246 |
| Ethiopians | 84.8 /100 | #142 | Excellent $56,243 |
| Sri Lankans | 83.4 /100 | #143 | Excellent $56,136 |
| Immigrants | Uganda | 82.4 /100 | #144 | Excellent $56,064 |
| Norwegians | 80.9 /100 | #145 | Excellent $55,965 |
| Immigrants | Chile | 80.7 /100 | #146 | Excellent $55,954 |
| Immigrants | Philippines | 78.4 /100 | #147 | Good $55,809 |
| Scottish | 78.2 /100 | #148 | Good $55,793 |
| English | 77.4 /100 | #149 | Good $55,747 |
| Swiss | 77.1 /100 | #150 | Good $55,731 |
| Immigrants | Oceania | 76.8 /100 | #151 | Good $55,712 |
| Peruvians | 75.8 /100 | #152 | Good $55,659 |
| Immigrants | Nepal | 75.0 /100 | #153 | Good $55,615 |
| Taiwanese | 73.9 /100 | #154 | Good $55,556 |
| Scandinavians | 73.4 /100 | #155 | Good $55,527 |
Demographics Similar to Immigrants from Eastern Europe by Median Male Earnings
In terms of median male earnings, the demographic groups most similar to Immigrants from Eastern Europe are Immigrants from Indonesia ($60,935, a difference of 0.040%), Immigrants from Pakistan ($60,987, a difference of 0.050%), Immigrants from Croatia ($60,914, a difference of 0.070%), Immigrants from Romania ($61,040, a difference of 0.13%), and Bolivian ($61,066, a difference of 0.18%).
| Demographics | Rating | Rank | Median Male Earnings |
| Immigrants | Scotland | 99.9 /100 | #57 | Exceptional $61,220 |
| New Zealanders | 99.9 /100 | #58 | Exceptional $61,199 |
| Immigrants | Netherlands | 99.8 /100 | #59 | Exceptional $61,096 |
| Egyptians | 99.8 /100 | #60 | Exceptional $61,095 |
| Bolivians | 99.8 /100 | #61 | Exceptional $61,066 |
| Immigrants | Romania | 99.8 /100 | #62 | Exceptional $61,040 |
| Immigrants | Pakistan | 99.8 /100 | #63 | Exceptional $60,987 |
| Immigrants | Eastern Europe | 99.8 /100 | #64 | Exceptional $60,958 |
| Immigrants | Indonesia | 99.8 /100 | #65 | Exceptional $60,935 |
| Immigrants | Croatia | 99.8 /100 | #66 | Exceptional $60,914 |
| Immigrants | Spain | 99.8 /100 | #67 | Exceptional $60,750 |
| Immigrants | Serbia | 99.7 /100 | #68 | Exceptional $60,600 |
| Immigrants | Canada | 99.7 /100 | #69 | Exceptional $60,388 |
| Immigrants | Bulgaria | 99.7 /100 | #70 | Exceptional $60,358 |
| Mongolians | 99.7 /100 | #71 | Exceptional $60,350 |