Samoan vs Mexican American Indian Median Female Earnings
COMPARE
Samoan
Mexican American Indian
Median Female Earnings
Median Female Earnings Comparison
Samoans
Mexican American Indians
$37,498
MEDIAN FEMALE EARNINGS
1.0/ 100
METRIC RATING
256th/ 347
METRIC RANK
$35,629
MEDIAN FEMALE EARNINGS
0.0/ 100
METRIC RATING
296th/ 347
METRIC RANK
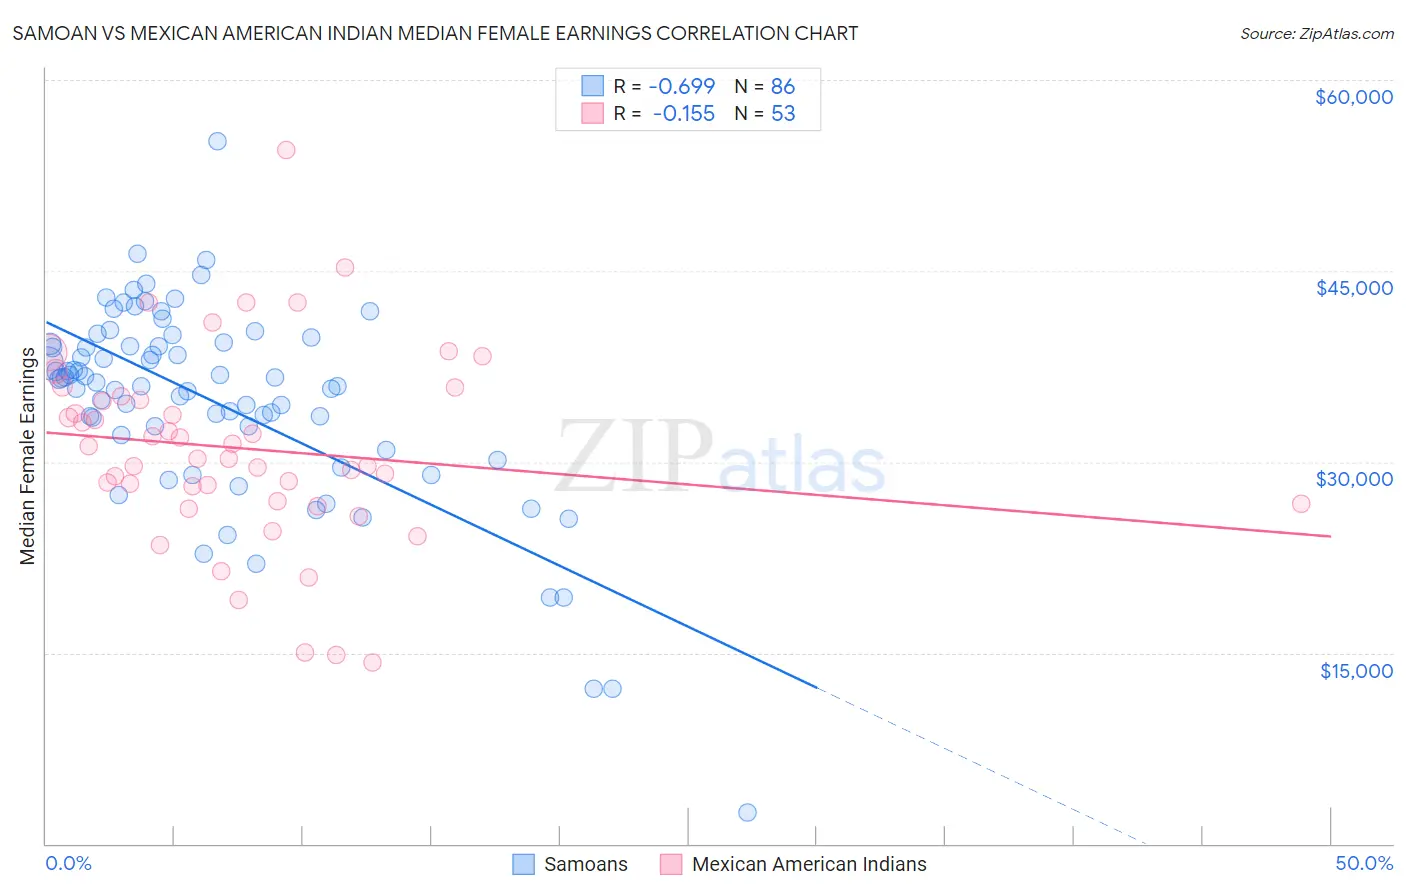
Samoan vs Mexican American Indian Median Female Earnings Correlation Chart
The statistical analysis conducted on geographies consisting of 225,122,971 people shows a significant negative correlation between the proportion of Samoans and median female earnings in the United States with a correlation coefficient (R) of -0.699 and weighted average of $37,498. Similarly, the statistical analysis conducted on geographies consisting of 317,476,651 people shows a poor negative correlation between the proportion of Mexican American Indians and median female earnings in the United States with a correlation coefficient (R) of -0.155 and weighted average of $35,629, a difference of 5.2%.
Median Female Earnings Correlation Summary
| Measurement | Samoan | Mexican American Indian |
| Minimum | $2,499 | $14,250 |
| Maximum | $55,213 | $54,477 |
| Range | $52,714 | $40,227 |
| Mean | $34,701 | $31,030 |
| Median | $36,357 | $30,267 |
| Interquartile 25% (IQ1) | $32,098 | $26,842 |
| Interquartile 75% (IQ3) | $39,275 | $35,013 |
| Interquartile Range (IQR) | $7,177 | $8,171 |
| Standard Deviation (Sample) | $8,002 | $7,625 |
| Standard Deviation (Population) | $7,955 | $7,553 |
Similar Demographics by Median Female Earnings
Demographics Similar to Samoans by Median Female Earnings
In terms of median female earnings, the demographic groups most similar to Samoans are Hawaiian ($37,497, a difference of 0.0%), Colville ($37,514, a difference of 0.040%), White/Caucasian ($37,531, a difference of 0.090%), Belizean ($37,429, a difference of 0.19%), and Scotch-Irish ($37,383, a difference of 0.31%).
| Demographics | Rating | Rank | Median Female Earnings |
| Swiss | 2.3 /100 | #249 | Tragic $37,904 |
| Immigrants | Iraq | 2.2 /100 | #250 | Tragic $37,864 |
| Welsh | 2.1 /100 | #251 | Tragic $37,856 |
| Immigrants | Dominica | 2.0 /100 | #252 | Tragic $37,825 |
| Danes | 1.6 /100 | #253 | Tragic $37,730 |
| Whites/Caucasians | 1.1 /100 | #254 | Tragic $37,531 |
| Colville | 1.1 /100 | #255 | Tragic $37,514 |
| Samoans | 1.0 /100 | #256 | Tragic $37,498 |
| Hawaiians | 1.0 /100 | #257 | Tragic $37,497 |
| Belizeans | 0.9 /100 | #258 | Tragic $37,429 |
| Scotch-Irish | 0.8 /100 | #259 | Tragic $37,383 |
| Dutch | 0.7 /100 | #260 | Tragic $37,339 |
| Malaysians | 0.7 /100 | #261 | Tragic $37,298 |
| Venezuelans | 0.7 /100 | #262 | Tragic $37,282 |
| German Russians | 0.5 /100 | #263 | Tragic $37,105 |
Demographics Similar to Mexican American Indians by Median Female Earnings
In terms of median female earnings, the demographic groups most similar to Mexican American Indians are Comanche ($35,661, a difference of 0.090%), Cheyenne ($35,673, a difference of 0.12%), Guatemalan ($35,695, a difference of 0.19%), Hmong ($35,498, a difference of 0.37%), and American ($35,777, a difference of 0.42%).
| Demographics | Rating | Rank | Median Female Earnings |
| Bangladeshis | 0.0 /100 | #289 | Tragic $35,960 |
| Central American Indians | 0.0 /100 | #290 | Tragic $35,930 |
| Blackfeet | 0.0 /100 | #291 | Tragic $35,864 |
| Americans | 0.0 /100 | #292 | Tragic $35,777 |
| Guatemalans | 0.0 /100 | #293 | Tragic $35,695 |
| Cheyenne | 0.0 /100 | #294 | Tragic $35,673 |
| Comanche | 0.0 /100 | #295 | Tragic $35,661 |
| Mexican American Indians | 0.0 /100 | #296 | Tragic $35,629 |
| Hmong | 0.0 /100 | #297 | Tragic $35,498 |
| Immigrants | Micronesia | 0.0 /100 | #298 | Tragic $35,477 |
| Immigrants | Guatemala | 0.0 /100 | #299 | Tragic $35,444 |
| Yuman | 0.0 /100 | #300 | Tragic $35,377 |
| Pima | 0.0 /100 | #301 | Tragic $35,326 |
| Blacks/African Americans | 0.0 /100 | #302 | Tragic $35,315 |
| Immigrants | Latin America | 0.0 /100 | #303 | Tragic $35,307 |