Immigrants from Cameroon vs Immigrants from Middle Africa Median Male Earnings
COMPARE
Immigrants from Cameroon
Immigrants from Middle Africa
Median Male Earnings
Median Male Earnings Comparison
Immigrants from Cameroon
Immigrants from Middle Africa
$52,119
MEDIAN MALE EARNINGS
8.9/ 100
METRIC RATING
215th/ 347
METRIC RANK
$49,201
MEDIAN MALE EARNINGS
0.6/ 100
METRIC RATING
264th/ 347
METRIC RANK
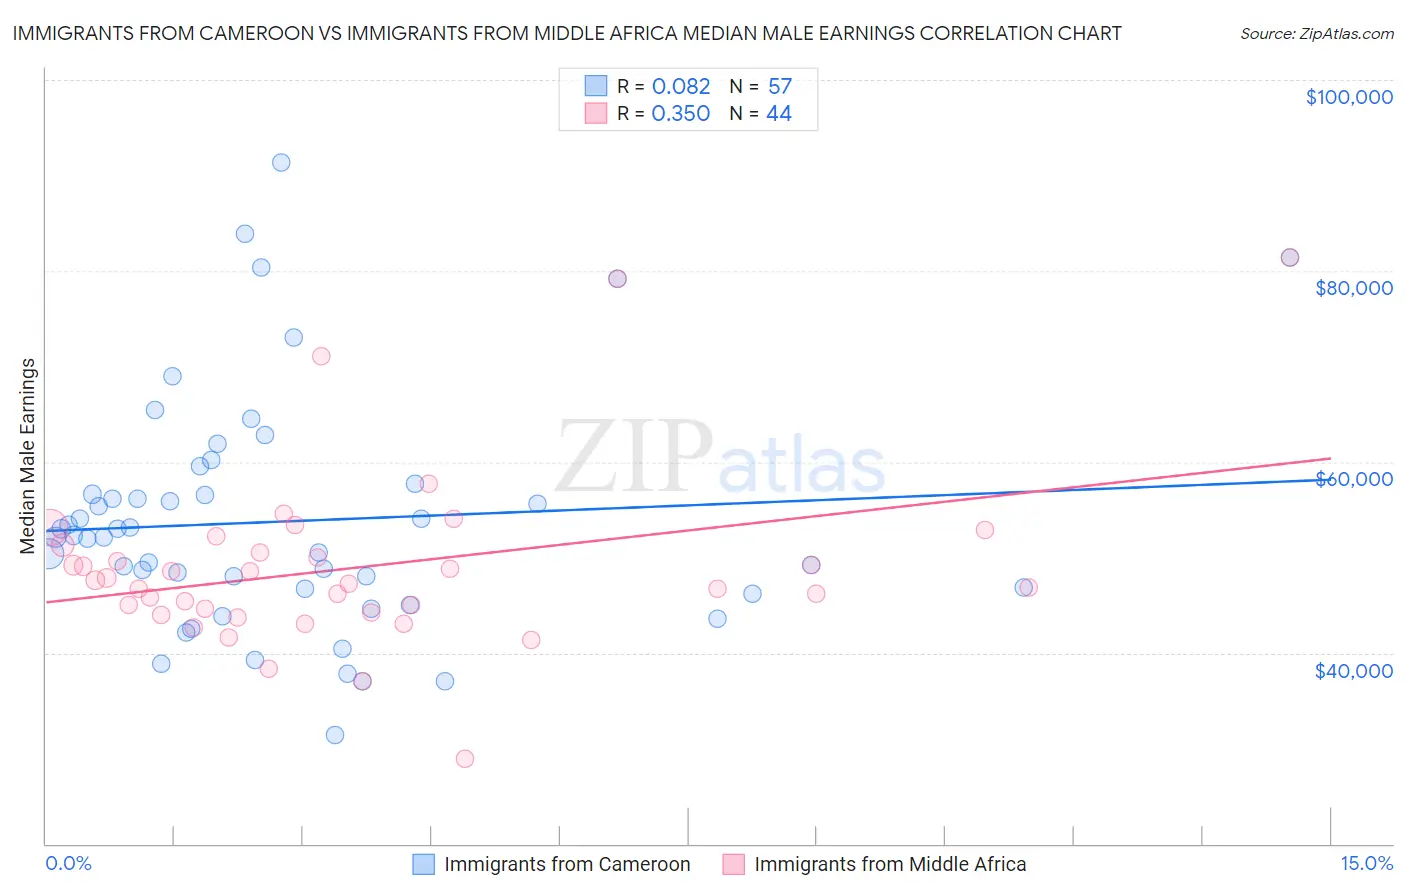
Immigrants from Cameroon vs Immigrants from Middle Africa Median Male Earnings Correlation Chart
The statistical analysis conducted on geographies consisting of 130,759,044 people shows a slight positive correlation between the proportion of Immigrants from Cameroon and median male earnings in the United States with a correlation coefficient (R) of 0.082 and weighted average of $52,119. Similarly, the statistical analysis conducted on geographies consisting of 202,728,043 people shows a mild positive correlation between the proportion of Immigrants from Middle Africa and median male earnings in the United States with a correlation coefficient (R) of 0.350 and weighted average of $49,201, a difference of 5.9%.
Median Male Earnings Correlation Summary
| Measurement | Immigrants from Cameroon | Immigrants from Middle Africa |
| Minimum | $31,418 | $28,882 |
| Maximum | $91,296 | $81,458 |
| Range | $59,878 | $52,576 |
| Mean | $53,781 | $48,940 |
| Median | $52,076 | $47,419 |
| Interquartile 25% (IQ1) | $46,476 | $44,462 |
| Interquartile 75% (IQ3) | $57,139 | $50,890 |
| Interquartile Range (IQR) | $10,663 | $6,428 |
| Standard Deviation (Sample) | $12,326 | $9,309 |
| Standard Deviation (Population) | $12,218 | $9,202 |
Similar Demographics by Median Male Earnings
Demographics Similar to Immigrants from Cameroon by Median Male Earnings
In terms of median male earnings, the demographic groups most similar to Immigrants from Cameroon are Nonimmigrants ($52,170, a difference of 0.10%), Immigrants from Venezuela ($52,041, a difference of 0.15%), Nigerian ($52,039, a difference of 0.15%), Immigrants from Panama ($51,962, a difference of 0.30%), and Native Hawaiian ($52,306, a difference of 0.36%).
| Demographics | Rating | Rank | Median Male Earnings |
| Venezuelans | 12.5 /100 | #208 | Poor $52,510 |
| Bermudans | 12.1 /100 | #209 | Poor $52,465 |
| Delaware | 11.5 /100 | #210 | Poor $52,412 |
| Tlingit-Haida | 11.5 /100 | #211 | Poor $52,409 |
| Cajuns | 10.7 /100 | #212 | Poor $52,325 |
| Native Hawaiians | 10.5 /100 | #213 | Poor $52,306 |
| Immigrants | Nonimmigrants | 9.3 /100 | #214 | Tragic $52,170 |
| Immigrants | Cameroon | 8.9 /100 | #215 | Tragic $52,119 |
| Immigrants | Venezuela | 8.3 /100 | #216 | Tragic $52,041 |
| Nigerians | 8.3 /100 | #217 | Tragic $52,039 |
| Immigrants | Panama | 7.7 /100 | #218 | Tragic $51,962 |
| Immigrants | Ghana | 6.9 /100 | #219 | Tragic $51,836 |
| Immigrants | Armenia | 6.6 /100 | #220 | Tragic $51,793 |
| Immigrants | Senegal | 5.8 /100 | #221 | Tragic $51,647 |
| Immigrants | Bangladesh | 5.8 /100 | #222 | Tragic $51,642 |
Demographics Similar to Immigrants from Middle Africa by Median Male Earnings
In terms of median male earnings, the demographic groups most similar to Immigrants from Middle Africa are Immigrants from Laos ($49,190, a difference of 0.020%), Nicaraguan ($49,215, a difference of 0.030%), Immigrants from West Indies ($49,271, a difference of 0.14%), Liberian ($49,318, a difference of 0.24%), and Iroquois ($49,374, a difference of 0.35%).
| Demographics | Rating | Rank | Median Male Earnings |
| British West Indians | 0.8 /100 | #257 | Tragic $49,636 |
| Cree | 0.7 /100 | #258 | Tragic $49,497 |
| Nepalese | 0.7 /100 | #259 | Tragic $49,458 |
| Iroquois | 0.7 /100 | #260 | Tragic $49,374 |
| Liberians | 0.6 /100 | #261 | Tragic $49,318 |
| Immigrants | West Indies | 0.6 /100 | #262 | Tragic $49,271 |
| Nicaraguans | 0.6 /100 | #263 | Tragic $49,215 |
| Immigrants | Middle Africa | 0.6 /100 | #264 | Tragic $49,201 |
| Immigrants | Laos | 0.6 /100 | #265 | Tragic $49,190 |
| Somalis | 0.5 /100 | #266 | Tragic $49,025 |
| Spanish Americans | 0.5 /100 | #267 | Tragic $49,008 |
| Ute | 0.4 /100 | #268 | Tragic $48,899 |
| Tsimshian | 0.4 /100 | #269 | Tragic $48,836 |
| Potawatomi | 0.4 /100 | #270 | Tragic $48,768 |
| Cherokee | 0.3 /100 | #271 | Tragic $48,669 |