Russian vs Immigrants from Sweden Female Poverty Among 18-24 Year Olds
COMPARE
Russian
Immigrants from Sweden
Female Poverty Among 18-24 Year Olds
Female Poverty Among 18-24 Year Olds Comparison
Russians
Immigrants from Sweden
19.5%
FEMALE POVERTY AMONG 18-24 YEAR OLDS
91.5/ 100
METRIC RATING
136th/ 347
METRIC RANK
20.7%
FEMALE POVERTY AMONG 18-24 YEAR OLDS
6.8/ 100
METRIC RATING
227th/ 347
METRIC RANK
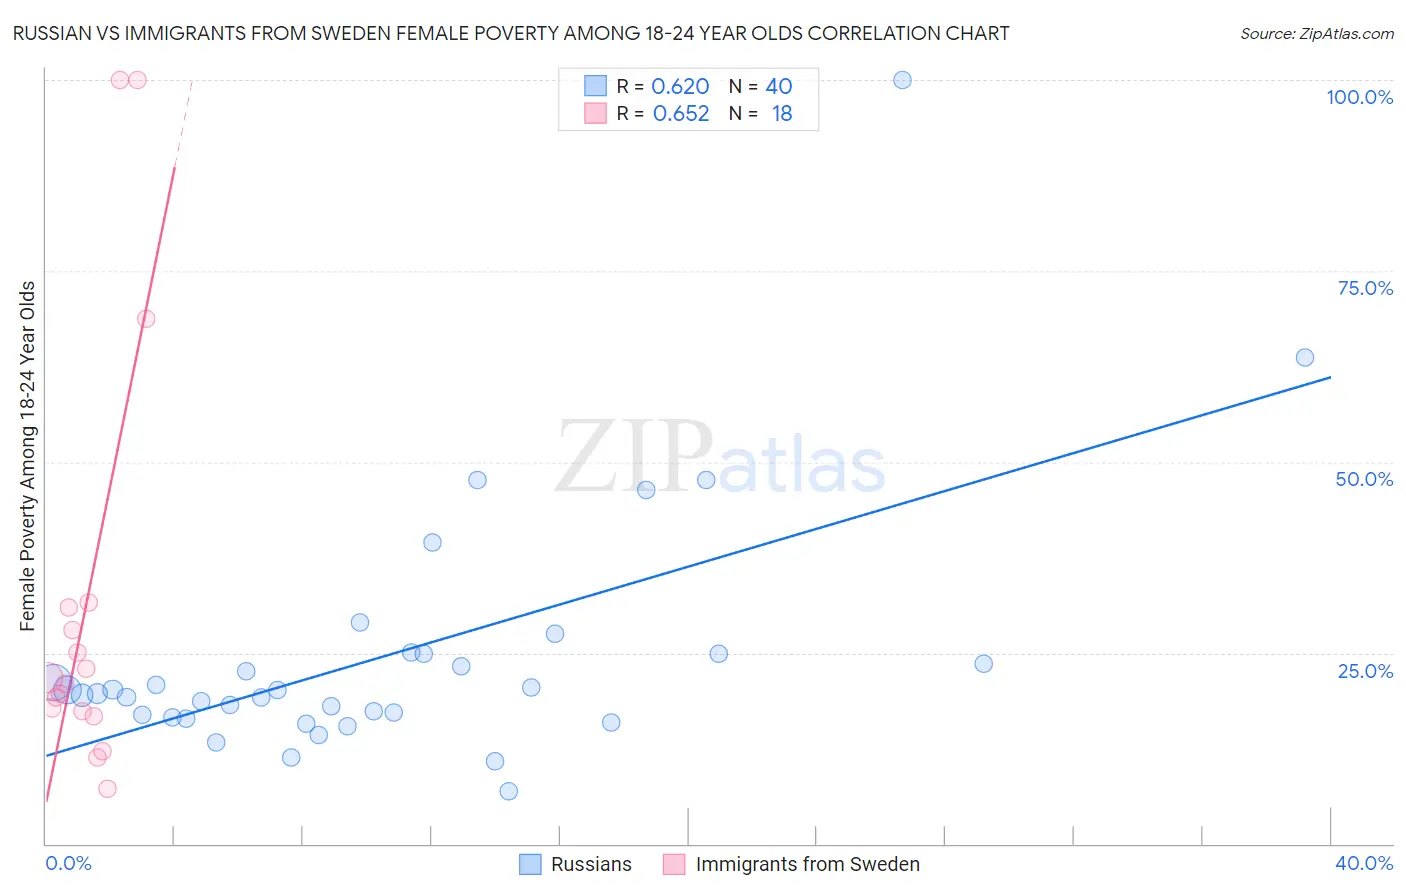
Russian vs Immigrants from Sweden Female Poverty Among 18-24 Year Olds Correlation Chart
The statistical analysis conducted on geographies consisting of 488,100,625 people shows a significant positive correlation between the proportion of Russians and poverty level among females between the ages 18 and 24 in the United States with a correlation coefficient (R) of 0.620 and weighted average of 19.5%. Similarly, the statistical analysis conducted on geographies consisting of 162,147,653 people shows a significant positive correlation between the proportion of Immigrants from Sweden and poverty level among females between the ages 18 and 24 in the United States with a correlation coefficient (R) of 0.652 and weighted average of 20.7%, a difference of 6.3%.
Female Poverty Among 18-24 Year Olds Correlation Summary
| Measurement | Russian | Immigrants from Sweden |
| Minimum | 6.9% | 7.1% |
| Maximum | 100.0% | 100.0% |
| Range | 93.1% | 92.9% |
| Mean | 24.7% | 31.7% |
| Median | 19.9% | 21.3% |
| Interquartile 25% (IQ1) | 16.7% | 17.3% |
| Interquartile 75% (IQ3) | 24.9% | 30.9% |
| Interquartile Range (IQR) | 8.2% | 13.5% |
| Standard Deviation (Sample) | 16.6% | 28.1% |
| Standard Deviation (Population) | 16.4% | 27.3% |
Similar Demographics by Female Poverty Among 18-24 Year Olds
Demographics Similar to Russians by Female Poverty Among 18-24 Year Olds
In terms of female poverty among 18-24 year olds, the demographic groups most similar to Russians are Soviet Union (19.5%, a difference of 0.090%), Jamaican (19.5%, a difference of 0.11%), Turkish (19.5%, a difference of 0.11%), Immigrants from North America (19.5%, a difference of 0.11%), and Austrian (19.5%, a difference of 0.12%).
| Demographics | Rating | Rank | Female Poverty Among 18-24 Year Olds |
| Immigrants | England | 92.9 /100 | #129 | Exceptional 19.5% |
| Immigrants | Canada | 92.9 /100 | #130 | Exceptional 19.5% |
| Latvians | 92.7 /100 | #131 | Exceptional 19.5% |
| Jamaicans | 92.1 /100 | #132 | Exceptional 19.5% |
| Turks | 92.1 /100 | #133 | Exceptional 19.5% |
| Immigrants | North America | 92.1 /100 | #134 | Exceptional 19.5% |
| Soviet Union | 92.0 /100 | #135 | Exceptional 19.5% |
| Russians | 91.5 /100 | #136 | Exceptional 19.5% |
| Austrians | 90.7 /100 | #137 | Exceptional 19.5% |
| Immigrants | Morocco | 89.9 /100 | #138 | Excellent 19.6% |
| Indians (Asian) | 88.3 /100 | #139 | Excellent 19.6% |
| Immigrants | Trinidad and Tobago | 85.6 /100 | #140 | Excellent 19.7% |
| Pennsylvania Germans | 85.5 /100 | #141 | Excellent 19.7% |
| Panamanians | 84.6 /100 | #142 | Excellent 19.7% |
| Slavs | 84.4 /100 | #143 | Excellent 19.7% |
Demographics Similar to Immigrants from Sweden by Female Poverty Among 18-24 Year Olds
In terms of female poverty among 18-24 year olds, the demographic groups most similar to Immigrants from Sweden are Ghanaian (20.8%, a difference of 0.060%), Estonian (20.7%, a difference of 0.070%), Norwegian (20.7%, a difference of 0.080%), Australian (20.8%, a difference of 0.13%), and White/Caucasian (20.8%, a difference of 0.13%).
| Demographics | Rating | Rank | Female Poverty Among 18-24 Year Olds |
| British | 9.4 /100 | #220 | Tragic 20.7% |
| Barbadians | 9.0 /100 | #221 | Tragic 20.7% |
| Guatemalans | 8.1 /100 | #222 | Tragic 20.7% |
| French | 7.9 /100 | #223 | Tragic 20.7% |
| Immigrants | Liberia | 7.6 /100 | #224 | Tragic 20.7% |
| Norwegians | 7.3 /100 | #225 | Tragic 20.7% |
| Estonians | 7.2 /100 | #226 | Tragic 20.7% |
| Immigrants | Sweden | 6.8 /100 | #227 | Tragic 20.7% |
| Ghanaians | 6.5 /100 | #228 | Tragic 20.8% |
| Australians | 6.1 /100 | #229 | Tragic 20.8% |
| Whites/Caucasians | 6.1 /100 | #230 | Tragic 20.8% |
| Immigrants | St. Vincent and the Grenadines | 6.0 /100 | #231 | Tragic 20.8% |
| Finns | 6.0 /100 | #232 | Tragic 20.8% |
| Immigrants | Denmark | 5.8 /100 | #233 | Tragic 20.8% |
| Welsh | 5.4 /100 | #234 | Tragic 20.8% |