New Zealander vs Immigrants from Poland Householder Income Over 65 years
COMPARE
New Zealander
Immigrants from Poland
Householder Income Over 65 years
Householder Income Over 65 years Comparison
New Zealanders
Immigrants from Poland
$67,333
HOUSEHOLDER INCOME OVER 65 YEARS
99.9/ 100
METRIC RATING
42nd/ 347
METRIC RANK
$61,041
HOUSEHOLDER INCOME OVER 65 YEARS
51.9/ 100
METRIC RATING
172nd/ 347
METRIC RANK
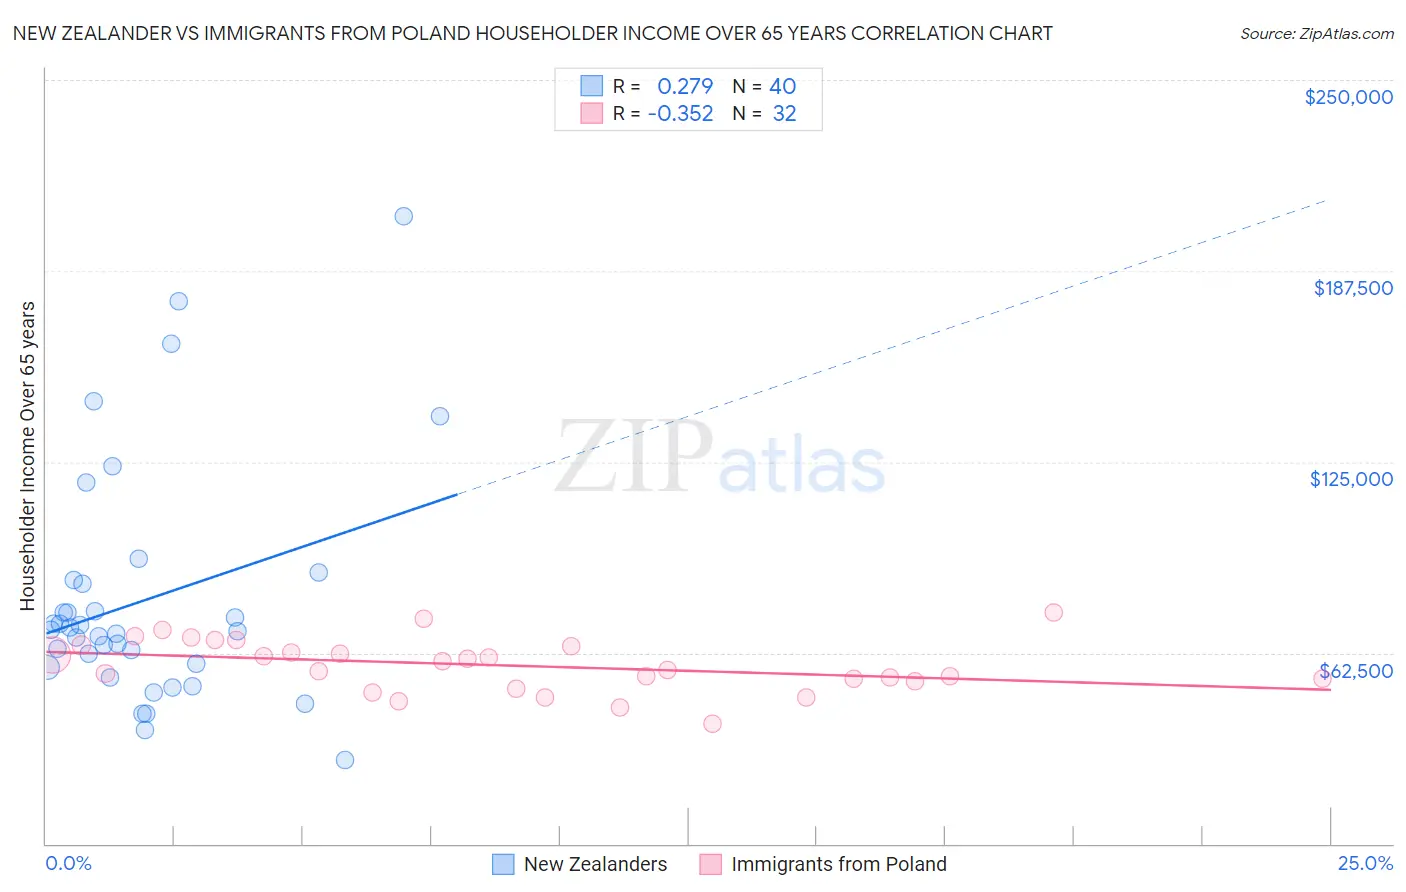
New Zealander vs Immigrants from Poland Householder Income Over 65 years Correlation Chart
The statistical analysis conducted on geographies consisting of 106,796,151 people shows a weak positive correlation between the proportion of New Zealanders and household income with householder over the age of 65 in the United States with a correlation coefficient (R) of 0.279 and weighted average of $67,333. Similarly, the statistical analysis conducted on geographies consisting of 304,365,401 people shows a mild negative correlation between the proportion of Immigrants from Poland and household income with householder over the age of 65 in the United States with a correlation coefficient (R) of -0.352 and weighted average of $61,041, a difference of 10.3%.
Householder Income Over 65 years Correlation Summary
| Measurement | New Zealander | Immigrants from Poland |
| Minimum | $27,419 | $39,327 |
| Maximum | $205,469 | $75,833 |
| Range | $178,050 | $36,506 |
| Mean | $79,932 | $58,395 |
| Median | $69,710 | $58,314 |
| Interquartile 25% (IQ1) | $58,322 | $53,627 |
| Interquartile 75% (IQ3) | $85,553 | $64,869 |
| Interquartile Range (IQR) | $27,231 | $11,242 |
| Standard Deviation (Sample) | $38,798 | $8,628 |
| Standard Deviation (Population) | $38,310 | $8,492 |
Similar Demographics by Householder Income Over 65 years
Demographics Similar to New Zealanders by Householder Income Over 65 years
In terms of householder income over 65 years, the demographic groups most similar to New Zealanders are Latvian ($67,326, a difference of 0.010%), Immigrants from South Africa ($67,234, a difference of 0.15%), Korean ($67,472, a difference of 0.21%), Immigrants from Asia ($67,594, a difference of 0.39%), and Russian ($67,626, a difference of 0.44%).
| Demographics | Rating | Rank | Householder Income Over 65 years |
| Tongans | 100.0 /100 | #35 | Exceptional $68,235 |
| Immigrants | Austria | 99.9 /100 | #36 | Exceptional $68,208 |
| Turks | 99.9 /100 | #37 | Exceptional $68,037 |
| Estonians | 99.9 /100 | #38 | Exceptional $67,926 |
| Russians | 99.9 /100 | #39 | Exceptional $67,626 |
| Immigrants | Asia | 99.9 /100 | #40 | Exceptional $67,594 |
| Koreans | 99.9 /100 | #41 | Exceptional $67,472 |
| New Zealanders | 99.9 /100 | #42 | Exceptional $67,333 |
| Latvians | 99.9 /100 | #43 | Exceptional $67,326 |
| Immigrants | South Africa | 99.9 /100 | #44 | Exceptional $67,234 |
| Immigrants | Afghanistan | 99.8 /100 | #45 | Exceptional $67,007 |
| Cambodians | 99.8 /100 | #46 | Exceptional $66,892 |
| Australians | 99.8 /100 | #47 | Exceptional $66,891 |
| Immigrants | France | 99.8 /100 | #48 | Exceptional $66,826 |
| Immigrants | Indonesia | 99.8 /100 | #49 | Exceptional $66,694 |
Demographics Similar to Immigrants from Poland by Householder Income Over 65 years
In terms of householder income over 65 years, the demographic groups most similar to Immigrants from Poland are Inupiat ($61,061, a difference of 0.030%), Immigrants from Micronesia ($61,000, a difference of 0.070%), Serbian ($61,087, a difference of 0.080%), Irish ($61,097, a difference of 0.090%), and Carpatho Rusyn ($61,093, a difference of 0.090%).
| Demographics | Rating | Rank | Householder Income Over 65 years |
| Immigrants | Ukraine | 55.1 /100 | #165 | Average $61,163 |
| Immigrants | Eastern Africa | 55.0 /100 | #166 | Average $61,157 |
| Norwegians | 53.6 /100 | #167 | Average $61,104 |
| Irish | 53.4 /100 | #168 | Average $61,097 |
| Carpatho Rusyns | 53.3 /100 | #169 | Average $61,093 |
| Serbians | 53.1 /100 | #170 | Average $61,087 |
| Inupiat | 52.4 /100 | #171 | Average $61,061 |
| Immigrants | Poland | 51.9 /100 | #172 | Average $61,041 |
| Immigrants | Micronesia | 50.8 /100 | #173 | Average $61,000 |
| Luxembourgers | 50.0 /100 | #174 | Average $60,967 |
| Spaniards | 47.3 /100 | #175 | Average $60,866 |
| Spanish | 45.5 /100 | #176 | Average $60,795 |
| Alaska Natives | 44.3 /100 | #177 | Average $60,748 |
| Yup'ik | 43.7 /100 | #178 | Average $60,727 |
| Welsh | 42.2 /100 | #179 | Average $60,666 |