Immigrants from Latin America vs Immigrants from Poland Householder Income Over 65 years
COMPARE
Immigrants from Latin America
Immigrants from Poland
Householder Income Over 65 years
Householder Income Over 65 years Comparison
Immigrants from Latin America
Immigrants from Poland
$53,265
HOUSEHOLDER INCOME OVER 65 YEARS
0.0/ 100
METRIC RATING
297th/ 347
METRIC RANK
$61,041
HOUSEHOLDER INCOME OVER 65 YEARS
51.9/ 100
METRIC RATING
172nd/ 347
METRIC RANK
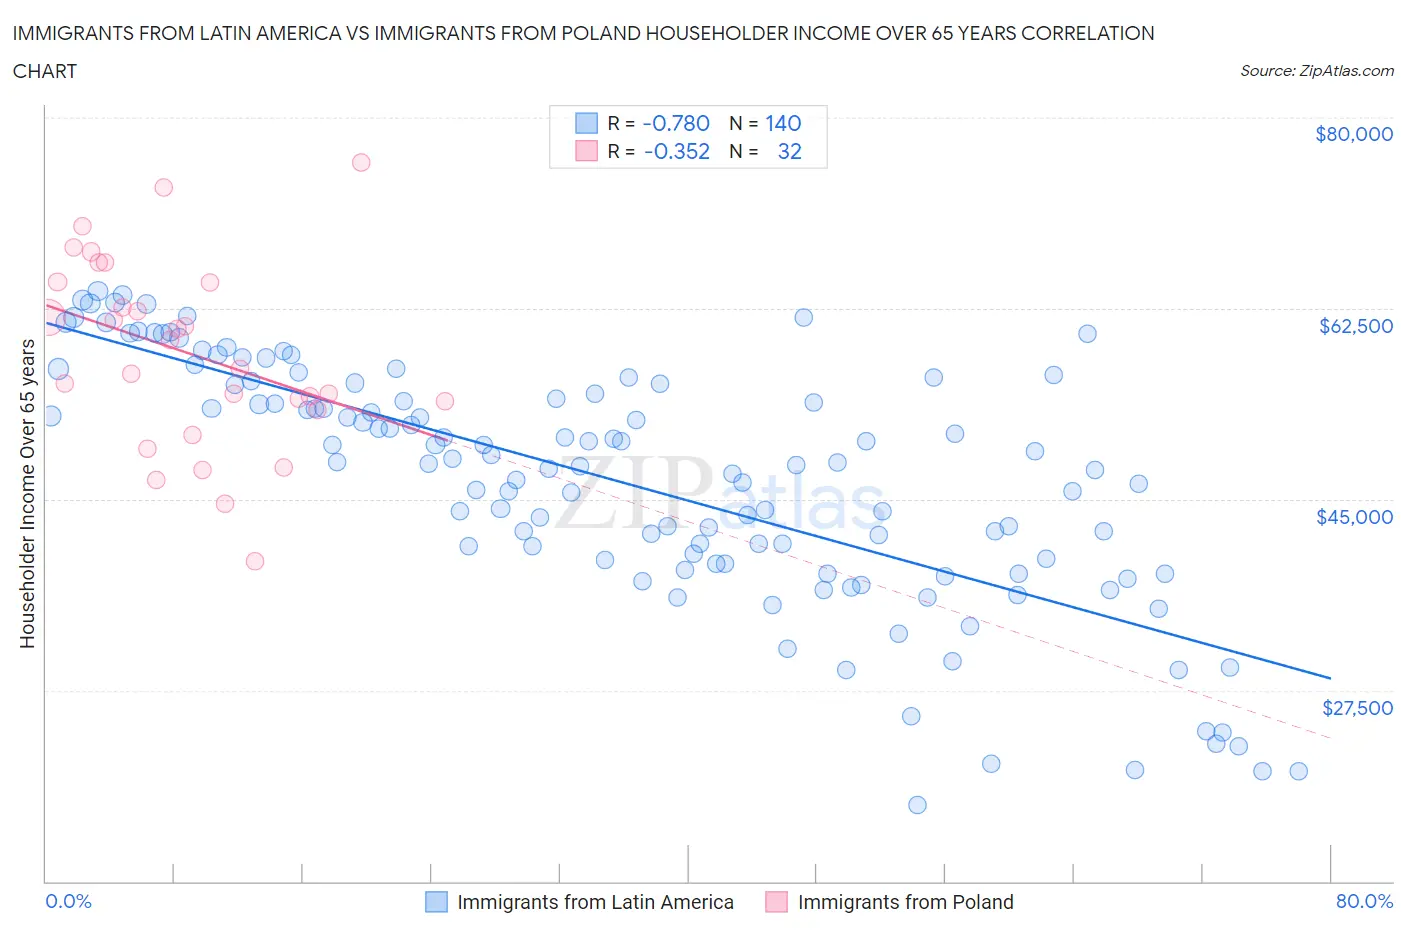
Immigrants from Latin America vs Immigrants from Poland Householder Income Over 65 years Correlation Chart
The statistical analysis conducted on geographies consisting of 553,755,892 people shows a strong negative correlation between the proportion of Immigrants from Latin America and household income with householder over the age of 65 in the United States with a correlation coefficient (R) of -0.780 and weighted average of $53,265. Similarly, the statistical analysis conducted on geographies consisting of 304,365,401 people shows a mild negative correlation between the proportion of Immigrants from Poland and household income with householder over the age of 65 in the United States with a correlation coefficient (R) of -0.352 and weighted average of $61,041, a difference of 14.6%.
Householder Income Over 65 years Correlation Summary
| Measurement | Immigrants from Latin America | Immigrants from Poland |
| Minimum | $17,032 | $39,327 |
| Maximum | $64,104 | $75,833 |
| Range | $47,072 | $36,506 |
| Mean | $46,627 | $58,395 |
| Median | $48,328 | $58,314 |
| Interquartile 25% (IQ1) | $39,297 | $53,627 |
| Interquartile 75% (IQ3) | $55,581 | $64,869 |
| Interquartile Range (IQR) | $16,283 | $11,242 |
| Standard Deviation (Sample) | $11,143 | $8,628 |
| Standard Deviation (Population) | $11,104 | $8,492 |
Similar Demographics by Householder Income Over 65 years
Demographics Similar to Immigrants from Latin America by Householder Income Over 65 years
In terms of householder income over 65 years, the demographic groups most similar to Immigrants from Latin America are Central American Indian ($53,232, a difference of 0.060%), Ottawa ($53,217, a difference of 0.090%), Immigrants from Somalia ($53,333, a difference of 0.13%), Immigrants from Bahamas ($53,174, a difference of 0.17%), and Immigrants from Central America ($53,420, a difference of 0.29%).
| Demographics | Rating | Rank | Householder Income Over 65 years |
| Chickasaw | 0.1 /100 | #290 | Tragic $53,732 |
| Africans | 0.0 /100 | #291 | Tragic $53,711 |
| Shoshone | 0.0 /100 | #292 | Tragic $53,681 |
| Immigrants | Belize | 0.0 /100 | #293 | Tragic $53,665 |
| Senegalese | 0.0 /100 | #294 | Tragic $53,591 |
| Immigrants | Central America | 0.0 /100 | #295 | Tragic $53,420 |
| Immigrants | Somalia | 0.0 /100 | #296 | Tragic $53,333 |
| Immigrants | Latin America | 0.0 /100 | #297 | Tragic $53,265 |
| Central American Indians | 0.0 /100 | #298 | Tragic $53,232 |
| Ottawa | 0.0 /100 | #299 | Tragic $53,217 |
| Immigrants | Bahamas | 0.0 /100 | #300 | Tragic $53,174 |
| Yuman | 0.0 /100 | #301 | Tragic $53,110 |
| Spanish American Indians | 0.0 /100 | #302 | Tragic $53,077 |
| Choctaw | 0.0 /100 | #303 | Tragic $53,060 |
| Ute | 0.0 /100 | #304 | Tragic $52,949 |
Demographics Similar to Immigrants from Poland by Householder Income Over 65 years
In terms of householder income over 65 years, the demographic groups most similar to Immigrants from Poland are Inupiat ($61,061, a difference of 0.030%), Immigrants from Micronesia ($61,000, a difference of 0.070%), Serbian ($61,087, a difference of 0.080%), Irish ($61,097, a difference of 0.090%), and Carpatho Rusyn ($61,093, a difference of 0.090%).
| Demographics | Rating | Rank | Householder Income Over 65 years |
| Immigrants | Ukraine | 55.1 /100 | #165 | Average $61,163 |
| Immigrants | Eastern Africa | 55.0 /100 | #166 | Average $61,157 |
| Norwegians | 53.6 /100 | #167 | Average $61,104 |
| Irish | 53.4 /100 | #168 | Average $61,097 |
| Carpatho Rusyns | 53.3 /100 | #169 | Average $61,093 |
| Serbians | 53.1 /100 | #170 | Average $61,087 |
| Inupiat | 52.4 /100 | #171 | Average $61,061 |
| Immigrants | Poland | 51.9 /100 | #172 | Average $61,041 |
| Immigrants | Micronesia | 50.8 /100 | #173 | Average $61,000 |
| Luxembourgers | 50.0 /100 | #174 | Average $60,967 |
| Spaniards | 47.3 /100 | #175 | Average $60,866 |
| Spanish | 45.5 /100 | #176 | Average $60,795 |
| Alaska Natives | 44.3 /100 | #177 | Average $60,748 |
| Yup'ik | 43.7 /100 | #178 | Average $60,727 |
| Welsh | 42.2 /100 | #179 | Average $60,666 |