Puerto Rican vs Immigrants Median Earnings
COMPARE
Puerto Rican
Immigrants
Median Earnings
Median Earnings Comparison
Puerto Ricans
Immigrants
$35,560
MEDIAN EARNINGS
0.0/ 100
METRIC RATING
347th/ 347
METRIC RANK
$46,478
MEDIAN EARNINGS
51.6/ 100
METRIC RATING
170th/ 347
METRIC RANK
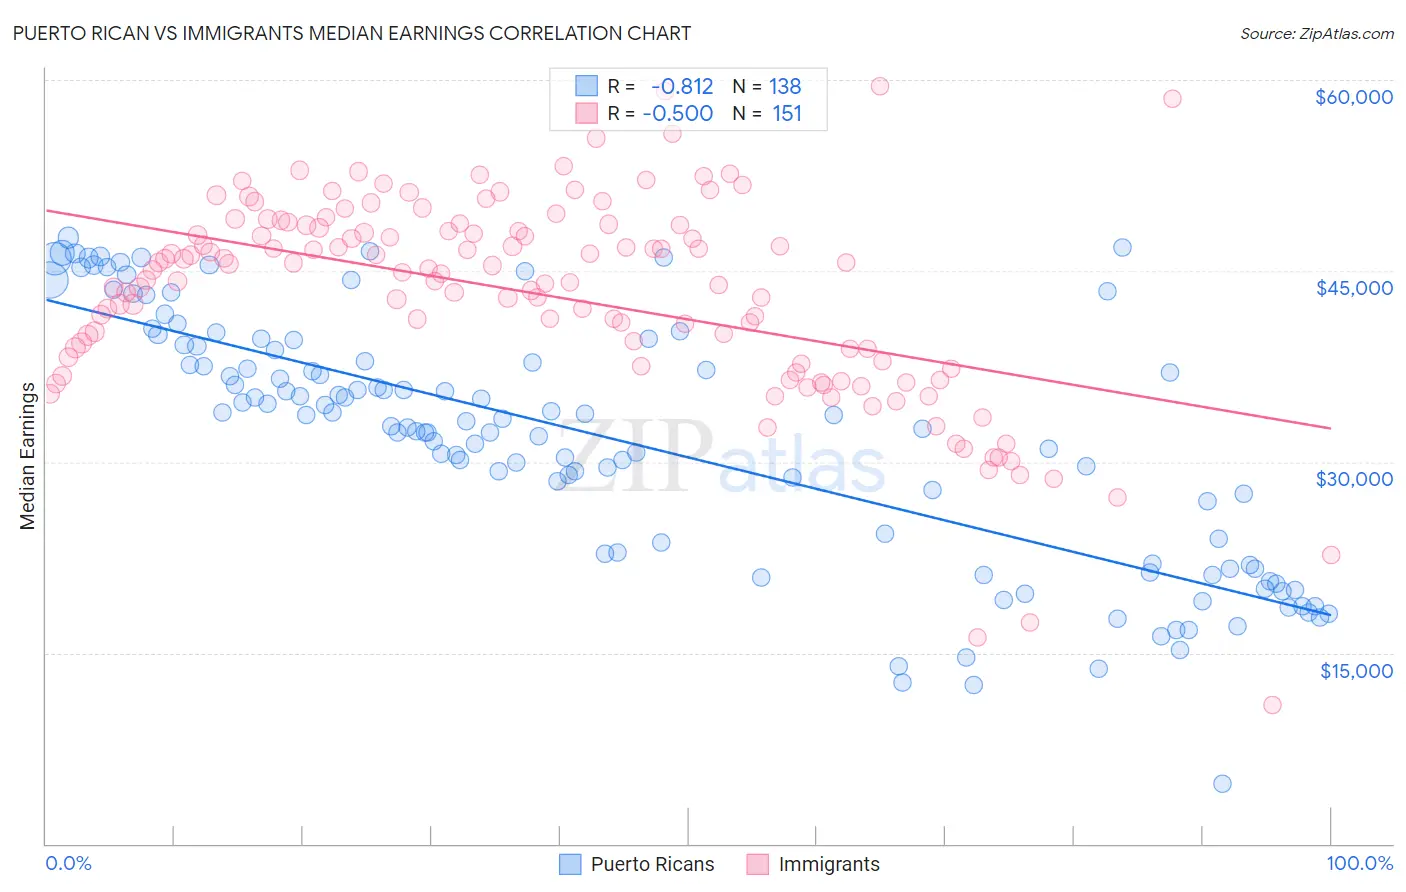
Puerto Rican vs Immigrants Median Earnings Correlation Chart
The statistical analysis conducted on geographies consisting of 528,218,544 people shows a very strong negative correlation between the proportion of Puerto Ricans and median earnings in the United States with a correlation coefficient (R) of -0.812 and weighted average of $35,560. Similarly, the statistical analysis conducted on geographies consisting of 576,851,611 people shows a substantial negative correlation between the proportion of Immigrants and median earnings in the United States with a correlation coefficient (R) of -0.500 and weighted average of $46,478, a difference of 30.7%.
Median Earnings Correlation Summary
| Measurement | Puerto Rican | Immigrants |
| Minimum | $4,737 | $10,941 |
| Maximum | $47,601 | $59,517 |
| Range | $42,864 | $48,576 |
| Mean | $31,795 | $43,122 |
| Median | $33,297 | $44,875 |
| Interquartile 25% (IQ1) | $22,818 | $37,857 |
| Interquartile 75% (IQ3) | $39,100 | $48,614 |
| Interquartile Range (IQR) | $16,282 | $10,757 |
| Standard Deviation (Sample) | $9,771 | $8,036 |
| Standard Deviation (Population) | $9,736 | $8,009 |
Similar Demographics by Median Earnings
Demographics Similar to Puerto Ricans by Median Earnings
In terms of median earnings, the demographic groups most similar to Puerto Ricans are Yup'ik ($35,942, a difference of 1.1%), Tohono O'odham ($36,349, a difference of 2.2%), Arapaho ($36,586, a difference of 2.9%), Pueblo ($36,859, a difference of 3.6%), and Hopi ($36,871, a difference of 3.7%).
| Demographics | Rating | Rank | Median Earnings |
| Houma | 0.0 /100 | #333 | Tragic $38,949 |
| Spanish American Indians | 0.0 /100 | #334 | Tragic $38,907 |
| Natives/Alaskans | 0.0 /100 | #335 | Tragic $38,896 |
| Crow | 0.0 /100 | #336 | Tragic $38,707 |
| Immigrants | Cuba | 0.0 /100 | #337 | Tragic $38,426 |
| Pima | 0.0 /100 | #338 | Tragic $38,285 |
| Menominee | 0.0 /100 | #339 | Tragic $37,884 |
| Navajo | 0.0 /100 | #340 | Tragic $36,999 |
| Lumbee | 0.0 /100 | #341 | Tragic $36,876 |
| Hopi | 0.0 /100 | #342 | Tragic $36,871 |
| Pueblo | 0.0 /100 | #343 | Tragic $36,859 |
| Arapaho | 0.0 /100 | #344 | Tragic $36,586 |
| Tohono O'odham | 0.0 /100 | #345 | Tragic $36,349 |
| Yup'ik | 0.0 /100 | #346 | Tragic $35,942 |
| Puerto Ricans | 0.0 /100 | #347 | Tragic $35,560 |
Demographics Similar to Immigrants by Median Earnings
In terms of median earnings, the demographic groups most similar to Immigrants are Scottish ($46,463, a difference of 0.030%), Kenyan ($46,462, a difference of 0.030%), Ghanaian ($46,440, a difference of 0.080%), Scandinavian ($46,433, a difference of 0.10%), and Immigrants from South America ($46,548, a difference of 0.15%).
| Demographics | Rating | Rank | Median Earnings |
| Icelanders | 66.3 /100 | #163 | Good $46,916 |
| Norwegians | 64.7 /100 | #164 | Good $46,865 |
| South Americans | 62.7 /100 | #165 | Good $46,804 |
| Czechoslovakians | 57.8 /100 | #166 | Average $46,658 |
| Costa Ricans | 57.4 /100 | #167 | Average $46,645 |
| Immigrants | Africa | 54.6 /100 | #168 | Average $46,564 |
| Immigrants | South America | 54.0 /100 | #169 | Average $46,548 |
| Immigrants | Immigrants | 51.6 /100 | #170 | Average $46,478 |
| Scottish | 51.1 /100 | #171 | Average $46,463 |
| Kenyans | 51.0 /100 | #172 | Average $46,462 |
| Ghanaians | 50.3 /100 | #173 | Average $46,440 |
| Scandinavians | 50.0 /100 | #174 | Average $46,433 |
| Basques | 48.8 /100 | #175 | Average $46,399 |
| Danes | 48.6 /100 | #176 | Average $46,392 |
| Belgians | 48.0 /100 | #177 | Average $46,375 |