Lebanese vs Immigrants from Senegal Median Female Earnings
COMPARE
Lebanese
Immigrants from Senegal
Median Female Earnings
Median Female Earnings Comparison
Lebanese
Immigrants from Senegal
$40,006
MEDIAN FEMALE EARNINGS
65.5/ 100
METRIC RATING
163rd/ 347
METRIC RANK
$40,157
MEDIAN FEMALE EARNINGS
72.2/ 100
METRIC RATING
158th/ 347
METRIC RANK
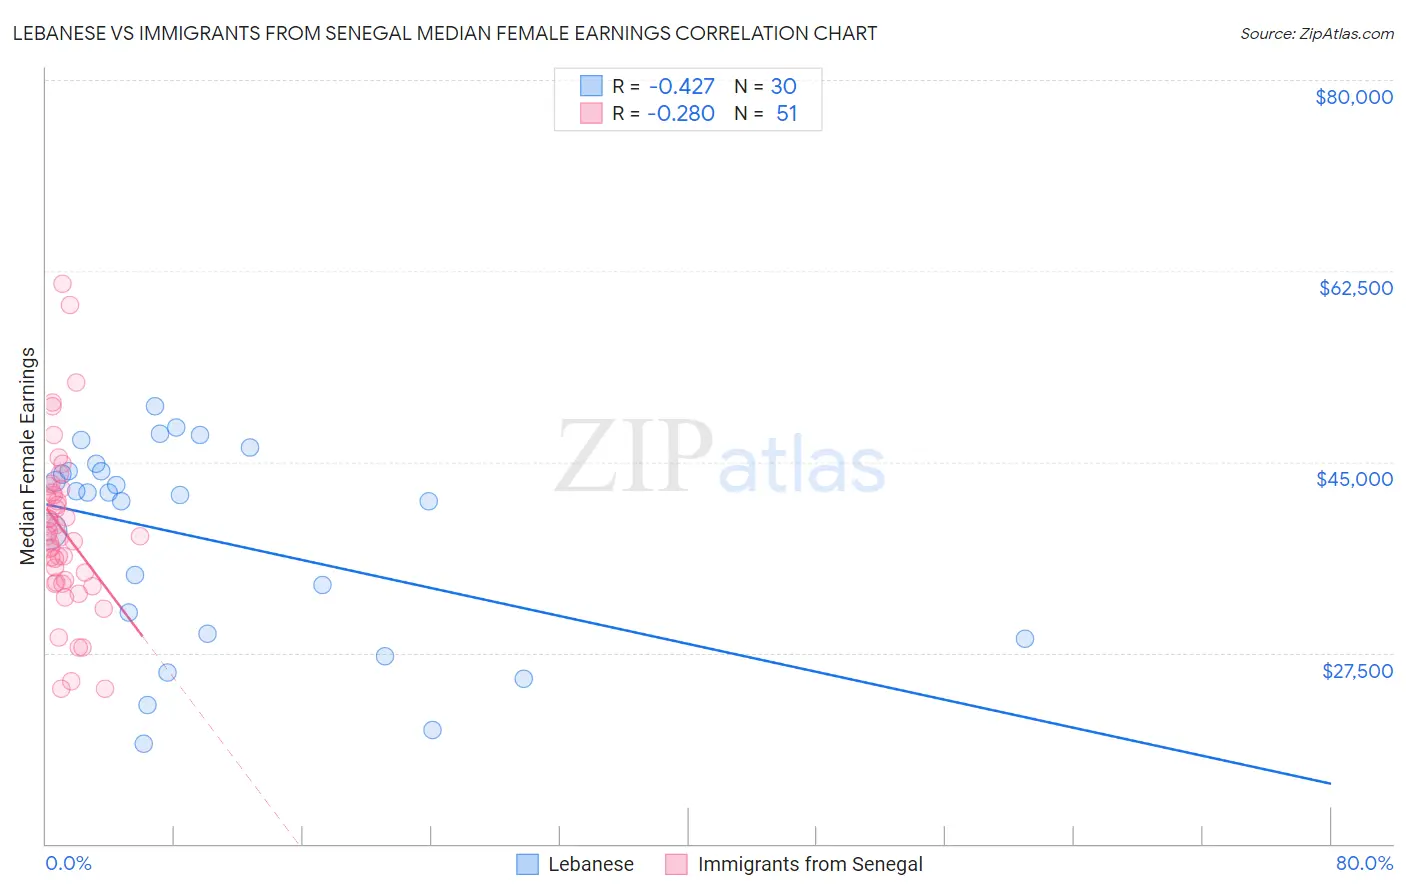
Lebanese vs Immigrants from Senegal Median Female Earnings Correlation Chart
The statistical analysis conducted on geographies consisting of 401,457,722 people shows a moderate negative correlation between the proportion of Lebanese and median female earnings in the United States with a correlation coefficient (R) of -0.427 and weighted average of $40,006. Similarly, the statistical analysis conducted on geographies consisting of 90,128,045 people shows a weak negative correlation between the proportion of Immigrants from Senegal and median female earnings in the United States with a correlation coefficient (R) of -0.280 and weighted average of $40,157, a difference of 0.38%.
Median Female Earnings Correlation Summary
| Measurement | Lebanese | Immigrants from Senegal |
| Minimum | $19,128 | $24,201 |
| Maximum | $50,050 | $61,281 |
| Range | $30,922 | $37,080 |
| Mean | $37,921 | $38,684 |
| Median | $42,088 | $38,134 |
| Interquartile 25% (IQ1) | $29,289 | $33,970 |
| Interquartile 75% (IQ3) | $44,167 | $42,197 |
| Interquartile Range (IQR) | $14,878 | $8,227 |
| Standard Deviation (Sample) | $9,199 | $7,634 |
| Standard Deviation (Population) | $9,044 | $7,559 |
Demographics Similar to Lebanese and Immigrants from Senegal by Median Female Earnings
In terms of median female earnings, the demographic groups most similar to Lebanese are South American Indian ($40,019, a difference of 0.030%), Alsatian ($40,060, a difference of 0.14%), Immigrants from Saudi Arabia ($39,952, a difference of 0.14%), Inupiat ($40,080, a difference of 0.18%), and Immigrants from Bangladesh ($39,910, a difference of 0.24%). Similarly, the demographic groups most similar to Immigrants from Senegal are Immigrants from Vietnam ($40,153, a difference of 0.010%), Portuguese ($40,177, a difference of 0.050%), Peruvian ($40,234, a difference of 0.19%), Inupiat ($40,080, a difference of 0.19%), and Alsatian ($40,060, a difference of 0.24%).
| Demographics | Rating | Rank | Median Female Earnings |
| Immigrants | Chile | 79.6 /100 | #150 | Good $40,353 |
| Immigrants | Armenia | 79.2 /100 | #151 | Good $40,340 |
| West Indians | 78.4 /100 | #152 | Good $40,317 |
| British West Indians | 77.7 /100 | #153 | Good $40,299 |
| Immigrants | Oceania | 77.6 /100 | #154 | Good $40,297 |
| Immigrants | Africa | 76.2 /100 | #155 | Good $40,257 |
| Peruvians | 75.3 /100 | #156 | Good $40,234 |
| Portuguese | 73.0 /100 | #157 | Good $40,177 |
| Immigrants | Senegal | 72.2 /100 | #158 | Good $40,157 |
| Immigrants | Vietnam | 72.0 /100 | #159 | Good $40,153 |
| Inupiat | 68.9 /100 | #160 | Good $40,080 |
| Alsatians | 68.0 /100 | #161 | Good $40,060 |
| South American Indians | 66.1 /100 | #162 | Good $40,019 |
| Lebanese | 65.5 /100 | #163 | Good $40,006 |
| Immigrants | Saudi Arabia | 62.9 /100 | #164 | Good $39,952 |
| Immigrants | Bangladesh | 60.8 /100 | #165 | Good $39,910 |
| Immigrants | Ghana | 60.0 /100 | #166 | Good $39,894 |
| Luxembourgers | 59.9 /100 | #167 | Average $39,891 |
| Immigrants | Peru | 58.9 /100 | #168 | Average $39,871 |
| Kenyans | 58.4 /100 | #169 | Average $39,860 |
| Slovenes | 56.2 /100 | #170 | Average $39,817 |