Sudanese vs Immigrants from Chile Median Male Earnings
COMPARE
Sudanese
Immigrants from Chile
Median Male Earnings
Median Male Earnings Comparison
Sudanese
Immigrants from Chile
$51,216
MEDIAN MALE EARNINGS
3.9/ 100
METRIC RATING
232nd/ 347
METRIC RANK
$55,954
MEDIAN MALE EARNINGS
80.7/ 100
METRIC RATING
146th/ 347
METRIC RANK
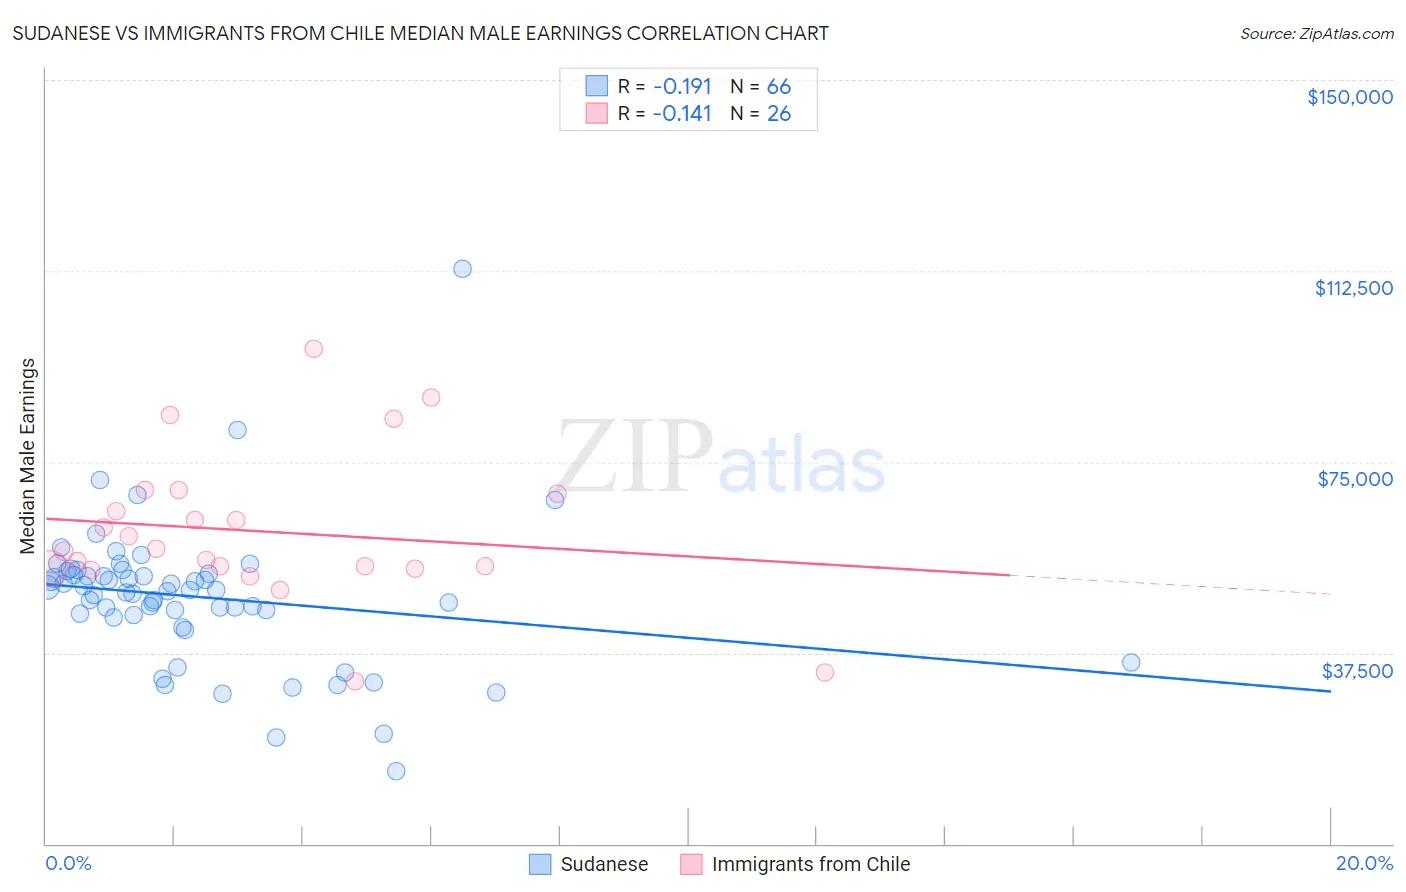
Sudanese vs Immigrants from Chile Median Male Earnings Correlation Chart
The statistical analysis conducted on geographies consisting of 110,150,959 people shows a poor negative correlation between the proportion of Sudanese and median male earnings in the United States with a correlation coefficient (R) of -0.191 and weighted average of $51,216. Similarly, the statistical analysis conducted on geographies consisting of 218,627,915 people shows a poor negative correlation between the proportion of Immigrants from Chile and median male earnings in the United States with a correlation coefficient (R) of -0.141 and weighted average of $55,954, a difference of 9.2%.
Median Male Earnings Correlation Summary
| Measurement | Sudanese | Immigrants from Chile |
| Minimum | $14,310 | $31,923 |
| Maximum | $113,008 | $97,095 |
| Range | $98,698 | $65,172 |
| Mean | $48,489 | $61,352 |
| Median | $49,650 | $57,670 |
| Interquartile 25% (IQ1) | $44,972 | $54,075 |
| Interquartile 75% (IQ3) | $53,130 | $68,667 |
| Interquartile Range (IQR) | $8,158 | $14,592 |
| Standard Deviation (Sample) | $14,082 | $14,742 |
| Standard Deviation (Population) | $13,975 | $14,456 |
Similar Demographics by Median Male Earnings
Demographics Similar to Sudanese by Median Male Earnings
In terms of median male earnings, the demographic groups most similar to Sudanese are Barbadian ($51,236, a difference of 0.040%), Aleut ($51,168, a difference of 0.090%), Immigrants from Nigeria ($51,310, a difference of 0.18%), Cape Verdean ($51,103, a difference of 0.22%), and Immigrants from Trinidad and Tobago ($51,376, a difference of 0.31%).
| Demographics | Rating | Rank | Median Male Earnings |
| Immigrants | Sudan | 5.0 /100 | #225 | Tragic $51,489 |
| Japanese | 4.9 /100 | #226 | Tragic $51,473 |
| Trinidadians and Tobagonians | 4.8 /100 | #227 | Tragic $51,446 |
| Samoans | 4.6 /100 | #228 | Tragic $51,389 |
| Immigrants | Trinidad and Tobago | 4.5 /100 | #229 | Tragic $51,376 |
| Immigrants | Nigeria | 4.2 /100 | #230 | Tragic $51,310 |
| Barbadians | 3.9 /100 | #231 | Tragic $51,236 |
| Sudanese | 3.9 /100 | #232 | Tragic $51,216 |
| Aleuts | 3.7 /100 | #233 | Tragic $51,168 |
| Cape Verdeans | 3.5 /100 | #234 | Tragic $51,103 |
| Immigrants | Western Africa | 3.0 /100 | #235 | Tragic $50,940 |
| Pennsylvania Germans | 2.8 /100 | #236 | Tragic $50,878 |
| Immigrants | Barbados | 2.6 /100 | #237 | Tragic $50,795 |
| Malaysians | 2.5 /100 | #238 | Tragic $50,772 |
| Americans | 2.5 /100 | #239 | Tragic $50,761 |
Demographics Similar to Immigrants from Chile by Median Male Earnings
In terms of median male earnings, the demographic groups most similar to Immigrants from Chile are Norwegian ($55,965, a difference of 0.020%), Immigrants from Uganda ($56,064, a difference of 0.20%), Immigrants from Philippines ($55,809, a difference of 0.26%), Scottish ($55,793, a difference of 0.29%), and Sri Lankan ($56,136, a difference of 0.33%).
| Demographics | Rating | Rank | Median Male Earnings |
| Zimbabweans | 85.5 /100 | #139 | Excellent $56,302 |
| Luxembourgers | 85.5 /100 | #140 | Excellent $56,300 |
| Danes | 84.8 /100 | #141 | Excellent $56,246 |
| Ethiopians | 84.8 /100 | #142 | Excellent $56,243 |
| Sri Lankans | 83.4 /100 | #143 | Excellent $56,136 |
| Immigrants | Uganda | 82.4 /100 | #144 | Excellent $56,064 |
| Norwegians | 80.9 /100 | #145 | Excellent $55,965 |
| Immigrants | Chile | 80.7 /100 | #146 | Excellent $55,954 |
| Immigrants | Philippines | 78.4 /100 | #147 | Good $55,809 |
| Scottish | 78.2 /100 | #148 | Good $55,793 |
| English | 77.4 /100 | #149 | Good $55,747 |
| Swiss | 77.1 /100 | #150 | Good $55,731 |
| Immigrants | Oceania | 76.8 /100 | #151 | Good $55,712 |
| Peruvians | 75.8 /100 | #152 | Good $55,659 |
| Immigrants | Nepal | 75.0 /100 | #153 | Good $55,615 |