French vs Immigrants from Chile Median Male Earnings
COMPARE
French
Immigrants from Chile
Median Male Earnings
Median Male Earnings Comparison
French
Immigrants from Chile
$55,350
MEDIAN MALE EARNINGS
69.9/ 100
METRIC RATING
162nd/ 347
METRIC RANK
$55,954
MEDIAN MALE EARNINGS
80.7/ 100
METRIC RATING
146th/ 347
METRIC RANK
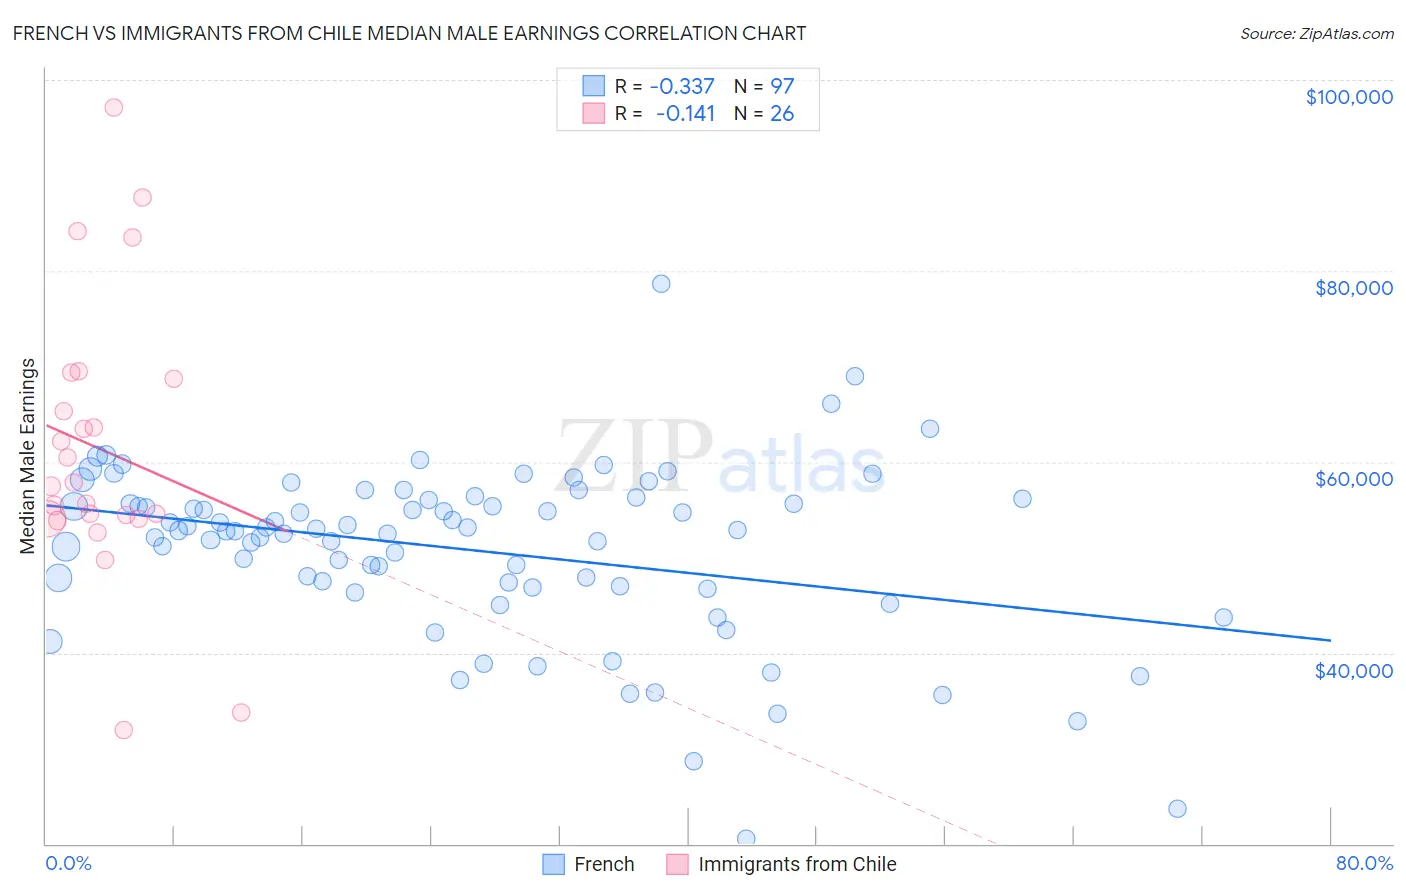
French vs Immigrants from Chile Median Male Earnings Correlation Chart
The statistical analysis conducted on geographies consisting of 571,095,815 people shows a mild negative correlation between the proportion of French and median male earnings in the United States with a correlation coefficient (R) of -0.337 and weighted average of $55,350. Similarly, the statistical analysis conducted on geographies consisting of 218,627,915 people shows a poor negative correlation between the proportion of Immigrants from Chile and median male earnings in the United States with a correlation coefficient (R) of -0.141 and weighted average of $55,954, a difference of 1.1%.
Median Male Earnings Correlation Summary
| Measurement | French | Immigrants from Chile |
| Minimum | $20,556 | $31,923 |
| Maximum | $78,663 | $97,095 |
| Range | $58,107 | $65,172 |
| Mean | $50,816 | $61,352 |
| Median | $52,806 | $57,670 |
| Interquartile 25% (IQ1) | $46,933 | $54,075 |
| Interquartile 75% (IQ3) | $56,096 | $68,667 |
| Interquartile Range (IQR) | $9,162 | $14,592 |
| Standard Deviation (Sample) | $9,122 | $14,742 |
| Standard Deviation (Population) | $9,075 | $14,456 |
Demographics Similar to French and Immigrants from Chile by Median Male Earnings
In terms of median male earnings, the demographic groups most similar to French are Belgian ($55,361, a difference of 0.020%), Basque ($55,370, a difference of 0.040%), Alsatian ($55,380, a difference of 0.050%), Czechoslovakian ($55,382, a difference of 0.060%), and Ugandan ($55,290, a difference of 0.11%). Similarly, the demographic groups most similar to Immigrants from Chile are Norwegian ($55,965, a difference of 0.020%), Immigrants from Uganda ($56,064, a difference of 0.20%), Immigrants from Philippines ($55,809, a difference of 0.26%), Scottish ($55,793, a difference of 0.29%), and English ($55,747, a difference of 0.37%).
| Demographics | Rating | Rank | Median Male Earnings |
| Immigrants | Uganda | 82.4 /100 | #144 | Excellent $56,064 |
| Norwegians | 80.9 /100 | #145 | Excellent $55,965 |
| Immigrants | Chile | 80.7 /100 | #146 | Excellent $55,954 |
| Immigrants | Philippines | 78.4 /100 | #147 | Good $55,809 |
| Scottish | 78.2 /100 | #148 | Good $55,793 |
| English | 77.4 /100 | #149 | Good $55,747 |
| Swiss | 77.1 /100 | #150 | Good $55,731 |
| Immigrants | Oceania | 76.8 /100 | #151 | Good $55,712 |
| Peruvians | 75.8 /100 | #152 | Good $55,659 |
| Immigrants | Nepal | 75.0 /100 | #153 | Good $55,615 |
| Taiwanese | 73.9 /100 | #154 | Good $55,556 |
| Scandinavians | 73.4 /100 | #155 | Good $55,527 |
| Immigrants | Ethiopia | 71.6 /100 | #156 | Good $55,434 |
| Icelanders | 71.2 /100 | #157 | Good $55,415 |
| Czechoslovakians | 70.5 /100 | #158 | Good $55,382 |
| Alsatians | 70.5 /100 | #159 | Good $55,380 |
| Basques | 70.3 /100 | #160 | Good $55,370 |
| Belgians | 70.1 /100 | #161 | Good $55,361 |
| French | 69.9 /100 | #162 | Good $55,350 |
| Ugandans | 68.6 /100 | #163 | Good $55,290 |
| Immigrants | South Eastern Asia | 67.6 /100 | #164 | Good $55,241 |