Immigrants from Taiwan vs Iraqi Median Family Income
COMPARE
Immigrants from Taiwan
Iraqi
Median Family Income
Median Family Income Comparison
Immigrants from Taiwan
Iraqis
$136,949
MEDIAN FAMILY INCOME
100.0/ 100
METRIC RATING
2nd/ 347
METRIC RANK
$100,658
MEDIAN FAMILY INCOME
26.3/ 100
METRIC RATING
193rd/ 347
METRIC RANK
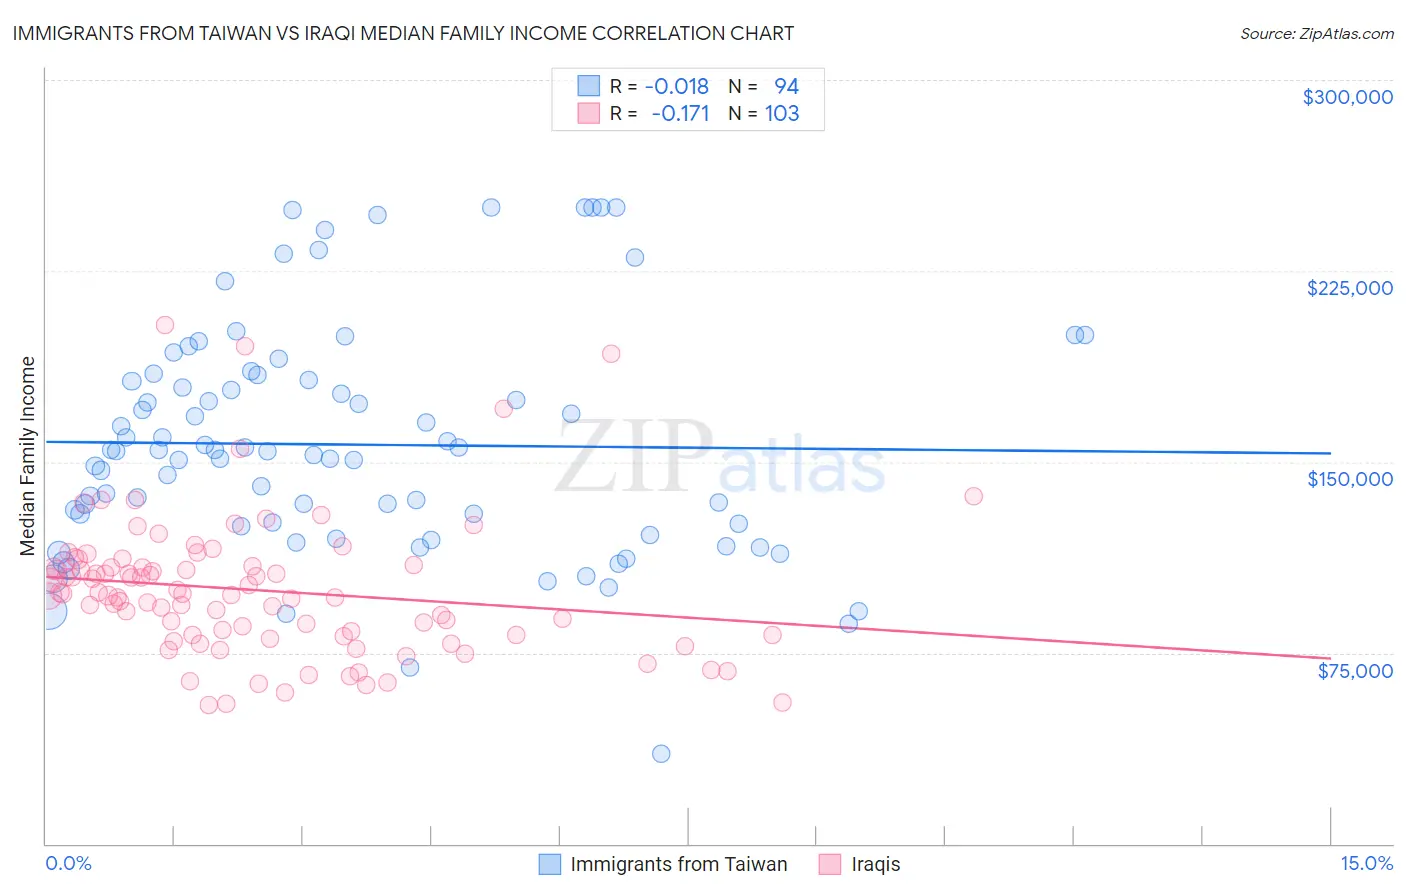
Immigrants from Taiwan vs Iraqi Median Family Income Correlation Chart
The statistical analysis conducted on geographies consisting of 298,070,874 people shows no correlation between the proportion of Immigrants from Taiwan and median family income in the United States with a correlation coefficient (R) of -0.018 and weighted average of $136,949. Similarly, the statistical analysis conducted on geographies consisting of 170,585,790 people shows a poor negative correlation between the proportion of Iraqis and median family income in the United States with a correlation coefficient (R) of -0.171 and weighted average of $100,658, a difference of 36.0%.
Median Family Income Correlation Summary
| Measurement | Immigrants from Taiwan | Iraqi |
| Minimum | $35,382 | $54,690 |
| Maximum | $250,001 | $203,844 |
| Range | $214,619 | $149,154 |
| Mean | $156,781 | $99,589 |
| Median | $154,299 | $97,704 |
| Interquartile 25% (IQ1) | $124,773 | $81,823 |
| Interquartile 75% (IQ3) | $182,305 | $109,149 |
| Interquartile Range (IQR) | $57,532 | $27,326 |
| Standard Deviation (Sample) | $45,464 | $27,377 |
| Standard Deviation (Population) | $45,222 | $27,244 |
Similar Demographics by Median Family Income
Demographics Similar to Immigrants from Taiwan by Median Family Income
In terms of median family income, the demographic groups most similar to Immigrants from Taiwan are Filipino ($138,397, a difference of 1.1%), Immigrants from Singapore ($134,818, a difference of 1.6%), Immigrants from India ($134,028, a difference of 2.2%), Iranian ($133,839, a difference of 2.3%), and Thai ($131,281, a difference of 4.3%).
| Demographics | Rating | Rank | Median Family Income |
| Filipinos | 100.0 /100 | #1 | Exceptional $138,397 |
| Immigrants | Taiwan | 100.0 /100 | #2 | Exceptional $136,949 |
| Immigrants | Singapore | 100.0 /100 | #3 | Exceptional $134,818 |
| Immigrants | India | 100.0 /100 | #4 | Exceptional $134,028 |
| Iranians | 100.0 /100 | #5 | Exceptional $133,839 |
| Thais | 100.0 /100 | #6 | Exceptional $131,281 |
| Immigrants | Hong Kong | 100.0 /100 | #7 | Exceptional $131,067 |
| Immigrants | Iran | 100.0 /100 | #8 | Exceptional $130,894 |
| Okinawans | 100.0 /100 | #9 | Exceptional $129,979 |
| Immigrants | Ireland | 100.0 /100 | #10 | Exceptional $127,584 |
| Immigrants | Israel | 100.0 /100 | #11 | Exceptional $127,430 |
| Cypriots | 100.0 /100 | #12 | Exceptional $127,064 |
| Immigrants | Australia | 100.0 /100 | #13 | Exceptional $126,620 |
| Immigrants | South Central Asia | 100.0 /100 | #14 | Exceptional $125,956 |
| Eastern Europeans | 100.0 /100 | #15 | Exceptional $125,546 |
Demographics Similar to Iraqis by Median Family Income
In terms of median family income, the demographic groups most similar to Iraqis are Uruguayan ($100,656, a difference of 0.0%), Immigrants from Kenya ($100,679, a difference of 0.020%), Colombian ($100,750, a difference of 0.090%), Immigrants from South America ($100,414, a difference of 0.24%), and Immigrants ($100,962, a difference of 0.30%).
| Demographics | Rating | Rank | Median Family Income |
| Celtics | 31.3 /100 | #186 | Fair $101,139 |
| Tlingit-Haida | 30.8 /100 | #187 | Fair $101,092 |
| Guamanians/Chamorros | 30.5 /100 | #188 | Fair $101,061 |
| Immigrants | Portugal | 29.6 /100 | #189 | Fair $100,984 |
| Immigrants | Immigrants | 29.4 /100 | #190 | Fair $100,962 |
| Colombians | 27.2 /100 | #191 | Fair $100,750 |
| Immigrants | Kenya | 26.5 /100 | #192 | Fair $100,679 |
| Iraqis | 26.3 /100 | #193 | Fair $100,658 |
| Uruguayans | 26.3 /100 | #194 | Fair $100,656 |
| Immigrants | South America | 23.9 /100 | #195 | Fair $100,414 |
| Samoans | 23.3 /100 | #196 | Fair $100,344 |
| Immigrants | Cameroon | 22.8 /100 | #197 | Fair $100,289 |
| Immigrants | Africa | 22.5 /100 | #198 | Fair $100,256 |
| Yugoslavians | 21.3 /100 | #199 | Fair $100,119 |
| Spanish | 20.1 /100 | #200 | Fair $99,977 |