Malaysian vs Immigrants from Armenia Householder Income Ages 25 - 44 years
COMPARE
Malaysian
Immigrants from Armenia
Householder Income Ages 25 - 44 years
Householder Income Ages 25 - 44 years Comparison
Malaysians
Immigrants from Armenia
$88,291
HOUSEHOLDER INCOME AGES 25 - 44 YEARS
3.0/ 100
METRIC RATING
233rd/ 347
METRIC RANK
$94,867
HOUSEHOLDER INCOME AGES 25 - 44 YEARS
54.2/ 100
METRIC RATING
171st/ 347
METRIC RANK
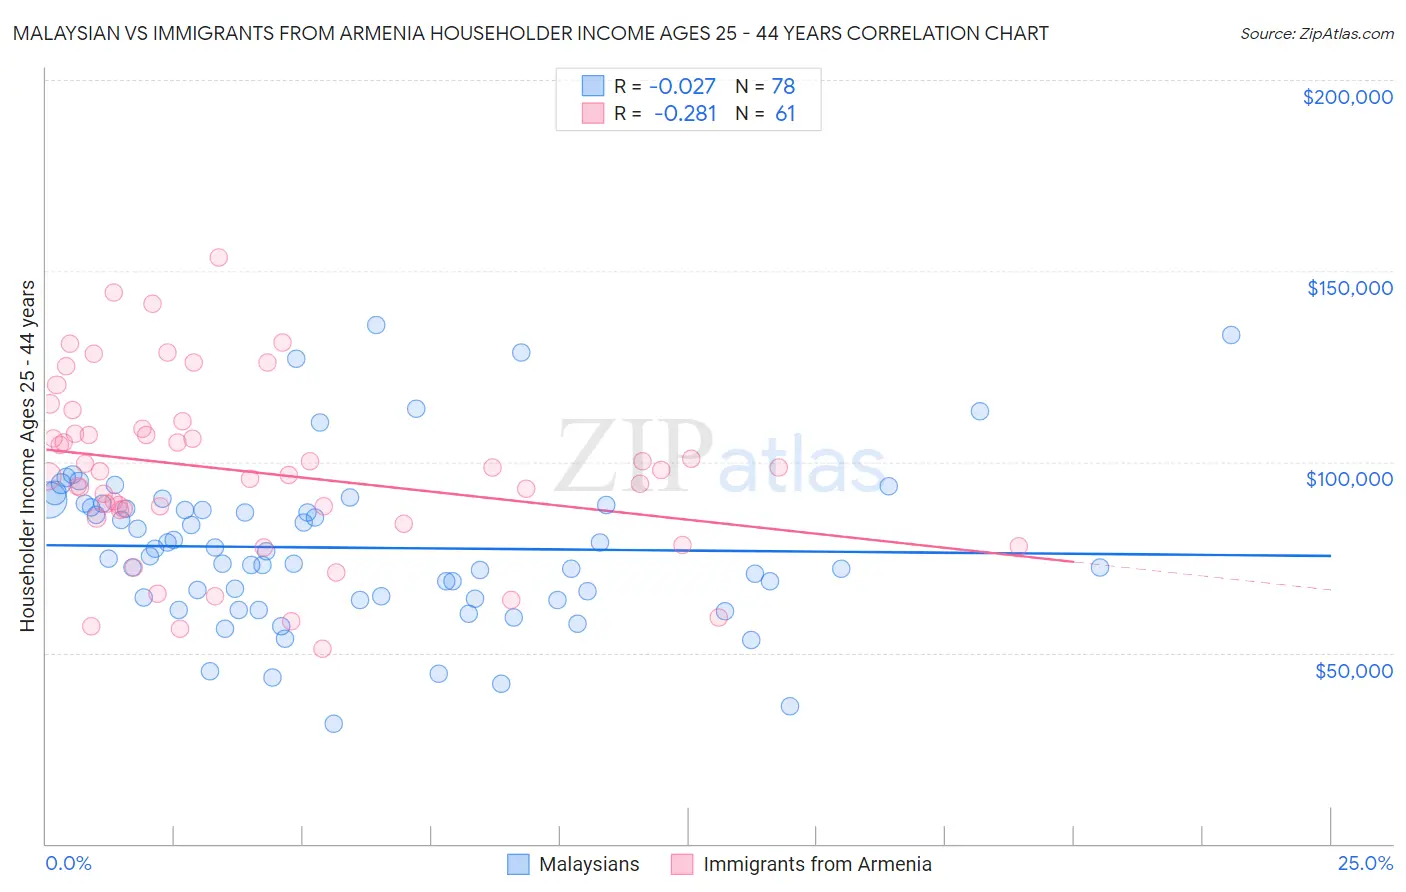
Malaysian vs Immigrants from Armenia Householder Income Ages 25 - 44 years Correlation Chart
The statistical analysis conducted on geographies consisting of 225,821,746 people shows no correlation between the proportion of Malaysians and household income with householder between the ages 25 and 44 in the United States with a correlation coefficient (R) of -0.027 and weighted average of $88,291. Similarly, the statistical analysis conducted on geographies consisting of 97,704,763 people shows a weak negative correlation between the proportion of Immigrants from Armenia and household income with householder between the ages 25 and 44 in the United States with a correlation coefficient (R) of -0.281 and weighted average of $94,867, a difference of 7.4%.
Householder Income Ages 25 - 44 years Correlation Summary
| Measurement | Malaysian | Immigrants from Armenia |
| Minimum | $31,500 | $50,938 |
| Maximum | $135,944 | $153,486 |
| Range | $104,444 | $102,548 |
| Mean | $77,509 | $97,387 |
| Median | $74,995 | $97,643 |
| Interquartile 25% (IQ1) | $64,000 | $86,360 |
| Interquartile 75% (IQ3) | $88,750 | $108,002 |
| Interquartile Range (IQR) | $24,750 | $21,642 |
| Standard Deviation (Sample) | $20,820 | $22,751 |
| Standard Deviation (Population) | $20,686 | $22,564 |
Similar Demographics by Householder Income Ages 25 - 44 years
Demographics Similar to Malaysians by Householder Income Ages 25 - 44 years
In terms of householder income ages 25 - 44 years, the demographic groups most similar to Malaysians are Nonimmigrants ($88,301, a difference of 0.010%), Immigrants from Grenada ($88,311, a difference of 0.020%), Venezuelan ($88,232, a difference of 0.070%), Bermudan ($88,231, a difference of 0.070%), and Immigrants from Cameroon ($88,214, a difference of 0.090%).
| Demographics | Rating | Rank | Householder Income Ages 25 - 44 years |
| Immigrants | Iraq | 5.5 /100 | #226 | Tragic $89,444 |
| Immigrants | St. Vincent and the Grenadines | 4.1 /100 | #227 | Tragic $88,888 |
| Immigrants | Bosnia and Herzegovina | 4.0 /100 | #228 | Tragic $88,819 |
| Immigrants | Barbados | 3.7 /100 | #229 | Tragic $88,687 |
| Alaskan Athabascans | 3.3 /100 | #230 | Tragic $88,446 |
| Immigrants | Grenada | 3.0 /100 | #231 | Tragic $88,311 |
| Immigrants | Nonimmigrants | 3.0 /100 | #232 | Tragic $88,301 |
| Malaysians | 3.0 /100 | #233 | Tragic $88,291 |
| Venezuelans | 2.9 /100 | #234 | Tragic $88,232 |
| Bermudans | 2.9 /100 | #235 | Tragic $88,231 |
| Immigrants | Cameroon | 2.9 /100 | #236 | Tragic $88,214 |
| Salvadorans | 2.8 /100 | #237 | Tragic $88,198 |
| Alaska Natives | 2.6 /100 | #238 | Tragic $88,018 |
| Immigrants | Ghana | 2.2 /100 | #239 | Tragic $87,760 |
| Nicaraguans | 2.2 /100 | #240 | Tragic $87,751 |
Demographics Similar to Immigrants from Armenia by Householder Income Ages 25 - 44 years
In terms of householder income ages 25 - 44 years, the demographic groups most similar to Immigrants from Armenia are Slovak ($95,032, a difference of 0.17%), Alsatian ($95,059, a difference of 0.20%), Native Hawaiian ($95,058, a difference of 0.20%), Czechoslovakian ($95,070, a difference of 0.21%), and Scottish ($94,622, a difference of 0.26%).
| Demographics | Rating | Rank | Householder Income Ages 25 - 44 years |
| South Americans | 60.9 /100 | #164 | Good $95,362 |
| Immigrants | Nepal | 60.3 /100 | #165 | Good $95,322 |
| Immigrants | Ethiopia | 59.5 /100 | #166 | Average $95,256 |
| Czechoslovakians | 57.0 /100 | #167 | Average $95,070 |
| Alsatians | 56.8 /100 | #168 | Average $95,059 |
| Native Hawaiians | 56.8 /100 | #169 | Average $95,058 |
| Slovaks | 56.4 /100 | #170 | Average $95,032 |
| Immigrants | Armenia | 54.2 /100 | #171 | Average $94,867 |
| Scottish | 50.8 /100 | #172 | Average $94,622 |
| Finns | 50.6 /100 | #173 | Average $94,610 |
| Colombians | 50.0 /100 | #174 | Average $94,565 |
| English | 48.1 /100 | #175 | Average $94,429 |
| Immigrants | Immigrants | 48.0 /100 | #176 | Average $94,423 |
| Belgians | 45.8 /100 | #177 | Average $94,262 |
| Immigrants | South America | 42.8 /100 | #178 | Average $94,042 |