Potawatomi vs Okinawan Householder Income Under 25 years
COMPARE
Potawatomi
Okinawan
Householder Income Under 25 years
Householder Income Under 25 years Comparison
Potawatomi
Okinawans
$46,462
HOUSEHOLDER INCOME UNDER 25 YEARS
0.0/ 100
METRIC RATING
321st/ 347
METRIC RANK
$54,701
HOUSEHOLDER INCOME UNDER 25 YEARS
99.8/ 100
METRIC RATING
67th/ 347
METRIC RANK
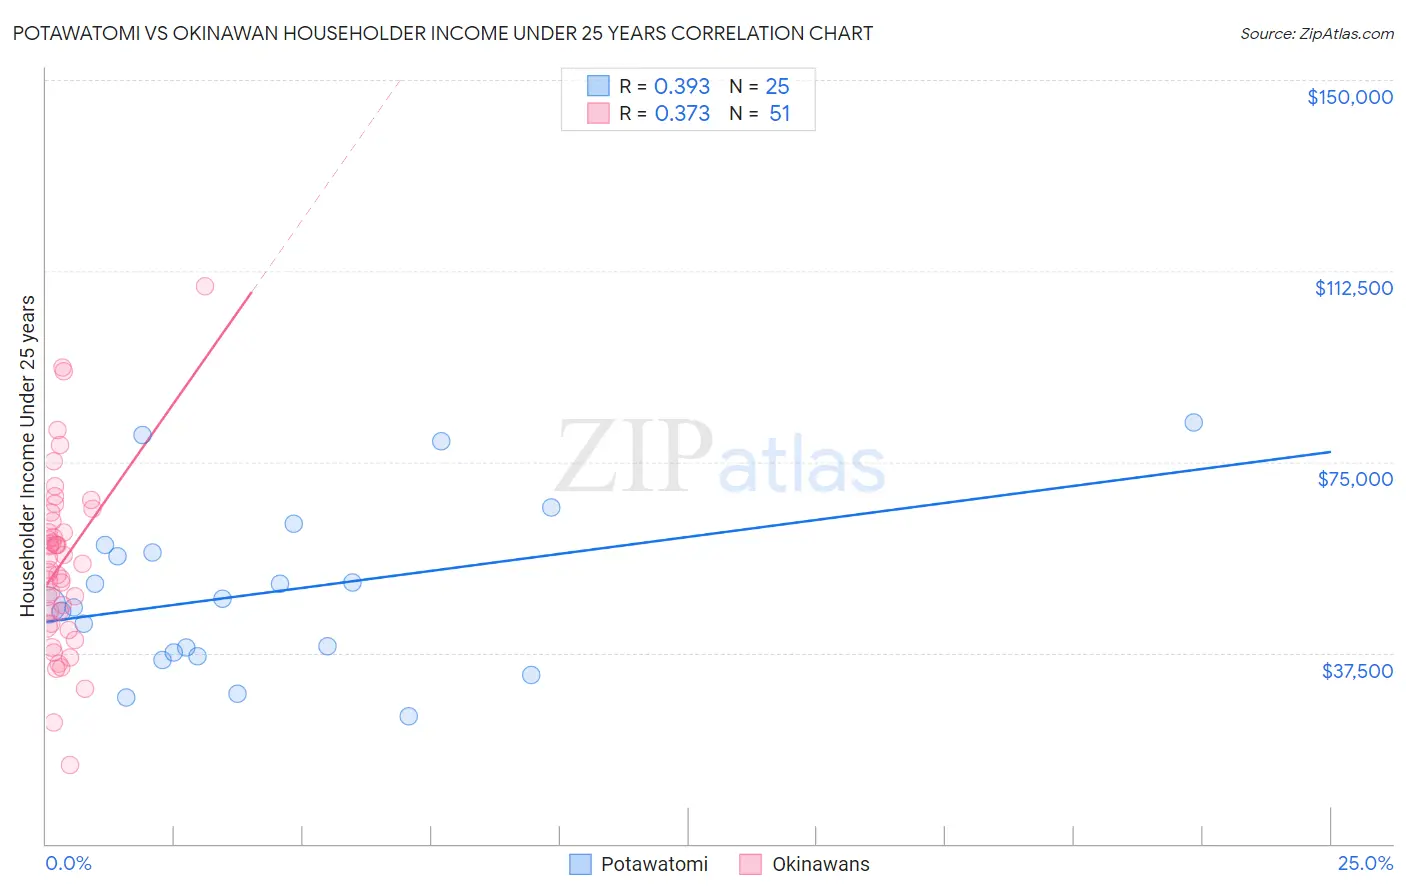
Potawatomi vs Okinawan Householder Income Under 25 years Correlation Chart
The statistical analysis conducted on geographies consisting of 111,079,287 people shows a mild positive correlation between the proportion of Potawatomi and household income with householder under the age of 25 in the United States with a correlation coefficient (R) of 0.393 and weighted average of $46,462. Similarly, the statistical analysis conducted on geographies consisting of 68,735,760 people shows a mild positive correlation between the proportion of Okinawans and household income with householder under the age of 25 in the United States with a correlation coefficient (R) of 0.373 and weighted average of $54,701, a difference of 17.7%.
Householder Income Under 25 years Correlation Summary
| Measurement | Potawatomi | Okinawan |
| Minimum | $25,000 | $15,399 |
| Maximum | $82,708 | $109,471 |
| Range | $57,708 | $94,072 |
| Mean | $49,228 | $55,169 |
| Median | $46,870 | $55,011 |
| Interquartile 25% (IQ1) | $37,131 | $43,283 |
| Interquartile 75% (IQ3) | $57,967 | $63,230 |
| Interquartile Range (IQR) | $20,836 | $19,947 |
| Standard Deviation (Sample) | $15,912 | $17,374 |
| Standard Deviation (Population) | $15,591 | $17,203 |
Similar Demographics by Householder Income Under 25 years
Demographics Similar to Potawatomi by Householder Income Under 25 years
In terms of householder income under 25 years, the demographic groups most similar to Potawatomi are Sioux ($46,417, a difference of 0.10%), Immigrants from Saudi Arabia ($46,187, a difference of 0.60%), Immigrants from Sudan ($46,791, a difference of 0.71%), African ($46,838, a difference of 0.81%), and Spanish American ($46,913, a difference of 0.97%).
| Demographics | Rating | Rank | Householder Income Under 25 years |
| Chippewa | 0.0 /100 | #314 | Tragic $47,015 |
| Crow | 0.0 /100 | #315 | Tragic $47,012 |
| Sudanese | 0.0 /100 | #316 | Tragic $46,982 |
| Hopi | 0.0 /100 | #317 | Tragic $46,978 |
| Spanish Americans | 0.0 /100 | #318 | Tragic $46,913 |
| Africans | 0.0 /100 | #319 | Tragic $46,838 |
| Immigrants | Sudan | 0.0 /100 | #320 | Tragic $46,791 |
| Potawatomi | 0.0 /100 | #321 | Tragic $46,462 |
| Sioux | 0.0 /100 | #322 | Tragic $46,417 |
| Immigrants | Saudi Arabia | 0.0 /100 | #323 | Tragic $46,187 |
| Dutch West Indians | 0.0 /100 | #324 | Tragic $45,816 |
| Immigrants | Bahamas | 0.0 /100 | #325 | Tragic $45,793 |
| Osage | 0.0 /100 | #326 | Tragic $45,764 |
| Bahamians | 0.0 /100 | #327 | Tragic $45,743 |
| German Russians | 0.0 /100 | #328 | Tragic $45,673 |
Demographics Similar to Okinawans by Householder Income Under 25 years
In terms of householder income under 25 years, the demographic groups most similar to Okinawans are Immigrants from Bangladesh ($54,714, a difference of 0.020%), Yup'ik ($54,732, a difference of 0.060%), Tsimshian ($54,649, a difference of 0.10%), Samoan ($54,610, a difference of 0.17%), and Burmese ($54,800, a difference of 0.18%).
| Demographics | Rating | Rank | Householder Income Under 25 years |
| Immigrants | Lithuania | 99.9 /100 | #60 | Exceptional $55,028 |
| Immigrants | Europe | 99.9 /100 | #61 | Exceptional $55,022 |
| Immigrants | Uzbekistan | 99.8 /100 | #62 | Exceptional $54,846 |
| Immigrants | Belgium | 99.8 /100 | #63 | Exceptional $54,830 |
| Burmese | 99.8 /100 | #64 | Exceptional $54,800 |
| Yup'ik | 99.8 /100 | #65 | Exceptional $54,732 |
| Immigrants | Bangladesh | 99.8 /100 | #66 | Exceptional $54,714 |
| Okinawans | 99.8 /100 | #67 | Exceptional $54,701 |
| Tsimshian | 99.8 /100 | #68 | Exceptional $54,649 |
| Samoans | 99.7 /100 | #69 | Exceptional $54,610 |
| Immigrants | El Salvador | 99.7 /100 | #70 | Exceptional $54,599 |
| Immigrants | Morocco | 99.7 /100 | #71 | Exceptional $54,593 |
| Immigrants | Northern Europe | 99.7 /100 | #72 | Exceptional $54,571 |
| Macedonians | 99.7 /100 | #73 | Exceptional $54,563 |
| Immigrants | Grenada | 99.7 /100 | #74 | Exceptional $54,538 |