Immigrants from Eritrea vs Okinawan Householder Income Ages 25 - 44 years
COMPARE
Immigrants from Eritrea
Okinawan
Householder Income Ages 25 - 44 years
Householder Income Ages 25 - 44 years Comparison
Immigrants from Eritrea
Okinawans
$93,466
HOUSEHOLDER INCOME AGES 25 - 44 YEARS
35.2/ 100
METRIC RATING
185th/ 347
METRIC RANK
$119,349
HOUSEHOLDER INCOME AGES 25 - 44 YEARS
100.0/ 100
METRIC RATING
11th/ 347
METRIC RANK
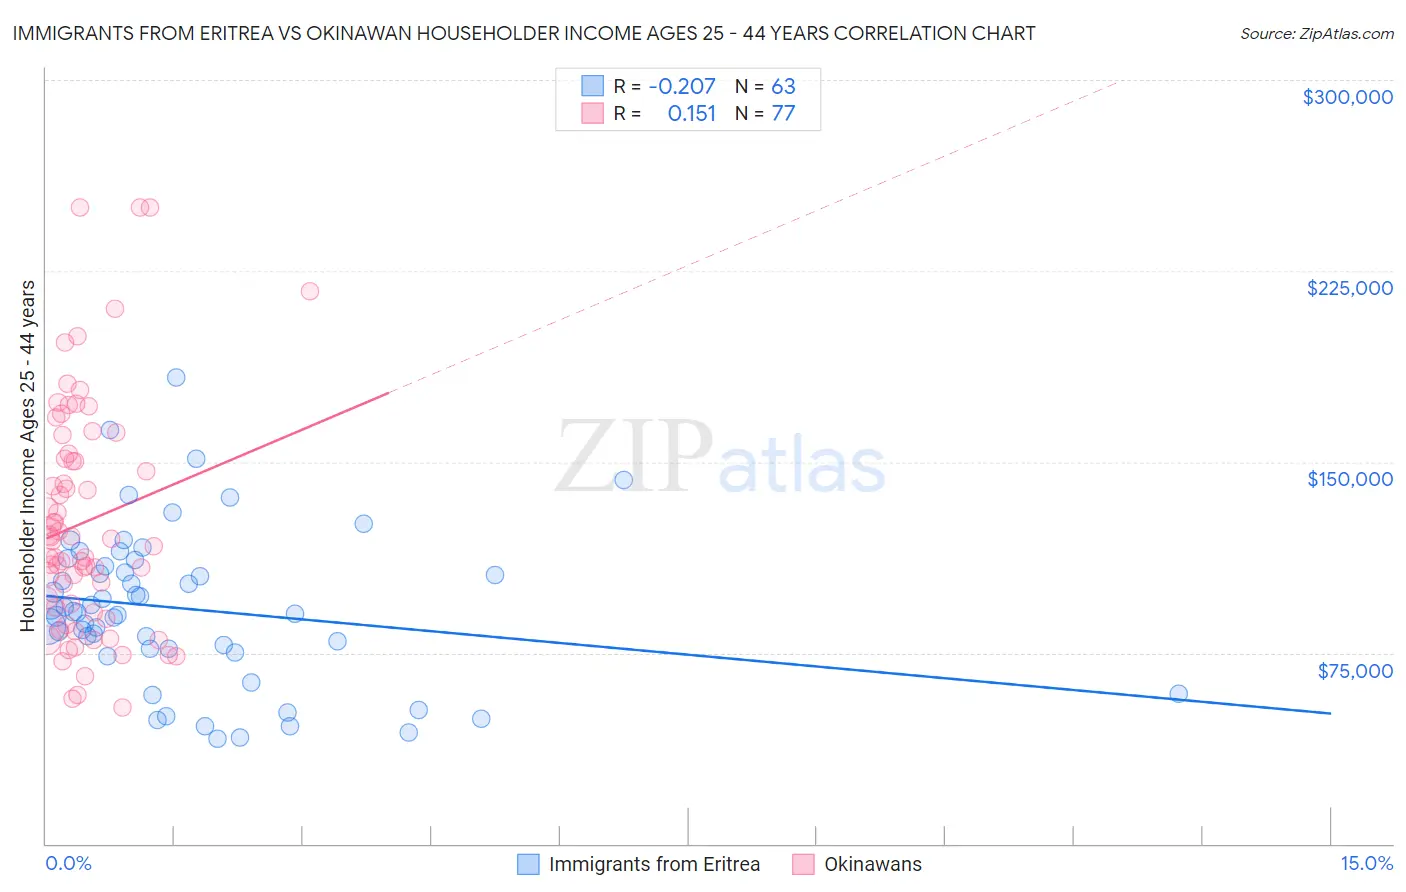
Immigrants from Eritrea vs Okinawan Householder Income Ages 25 - 44 years Correlation Chart
The statistical analysis conducted on geographies consisting of 104,828,872 people shows a weak negative correlation between the proportion of Immigrants from Eritrea and household income with householder between the ages 25 and 44 in the United States with a correlation coefficient (R) of -0.207 and weighted average of $93,466. Similarly, the statistical analysis conducted on geographies consisting of 73,689,702 people shows a poor positive correlation between the proportion of Okinawans and household income with householder between the ages 25 and 44 in the United States with a correlation coefficient (R) of 0.151 and weighted average of $119,349, a difference of 27.7%.
Householder Income Ages 25 - 44 years Correlation Summary
| Measurement | Immigrants from Eritrea | Okinawan |
| Minimum | $41,395 | $53,516 |
| Maximum | $183,112 | $250,001 |
| Range | $141,717 | $196,485 |
| Mean | $92,198 | $126,213 |
| Median | $91,003 | $118,882 |
| Interquartile 25% (IQ1) | $76,431 | $91,836 |
| Interquartile 75% (IQ3) | $109,130 | $152,291 |
| Interquartile Range (IQR) | $32,699 | $60,455 |
| Standard Deviation (Sample) | $30,253 | $45,314 |
| Standard Deviation (Population) | $30,012 | $45,019 |
Similar Demographics by Householder Income Ages 25 - 44 years
Demographics Similar to Immigrants from Eritrea by Householder Income Ages 25 - 44 years
In terms of householder income ages 25 - 44 years, the demographic groups most similar to Immigrants from Eritrea are Sierra Leonean ($93,435, a difference of 0.030%), German ($93,531, a difference of 0.070%), Guamanian/Chamorro ($93,569, a difference of 0.11%), Spaniard ($93,366, a difference of 0.11%), and Uruguayan ($93,631, a difference of 0.18%).
| Demographics | Rating | Rank | Householder Income Ages 25 - 44 years |
| Immigrants | South America | 42.8 /100 | #178 | Average $94,042 |
| French Canadians | 38.2 /100 | #179 | Fair $93,694 |
| French | 37.8 /100 | #180 | Fair $93,665 |
| Puget Sound Salish | 37.7 /100 | #181 | Fair $93,661 |
| Uruguayans | 37.3 /100 | #182 | Fair $93,631 |
| Guamanians/Chamorros | 36.5 /100 | #183 | Fair $93,569 |
| Germans | 36.0 /100 | #184 | Fair $93,531 |
| Immigrants | Eritrea | 35.2 /100 | #185 | Fair $93,466 |
| Sierra Leoneans | 34.8 /100 | #186 | Fair $93,435 |
| Spaniards | 34.0 /100 | #187 | Fair $93,366 |
| Immigrants | Sierra Leone | 30.9 /100 | #188 | Fair $93,115 |
| Dutch | 30.5 /100 | #189 | Fair $93,081 |
| Welsh | 30.0 /100 | #190 | Fair $93,039 |
| Tlingit-Haida | 29.4 /100 | #191 | Fair $92,987 |
| Immigrants | Costa Rica | 28.2 /100 | #192 | Fair $92,876 |
Demographics Similar to Okinawans by Householder Income Ages 25 - 44 years
In terms of householder income ages 25 - 44 years, the demographic groups most similar to Okinawans are Indian (Asian) ($119,496, a difference of 0.12%), Immigrants from Iran ($119,204, a difference of 0.12%), Immigrants from China ($119,756, a difference of 0.34%), Iranian ($120,292, a difference of 0.79%), and Immigrants from Ireland ($120,333, a difference of 0.82%).
| Demographics | Rating | Rank | Householder Income Ages 25 - 44 years |
| Immigrants | Singapore | 100.0 /100 | #4 | Exceptional $124,429 |
| Immigrants | India | 100.0 /100 | #5 | Exceptional $124,238 |
| Thais | 100.0 /100 | #6 | Exceptional $121,778 |
| Immigrants | Ireland | 100.0 /100 | #7 | Exceptional $120,333 |
| Iranians | 100.0 /100 | #8 | Exceptional $120,292 |
| Immigrants | China | 100.0 /100 | #9 | Exceptional $119,756 |
| Indians (Asian) | 100.0 /100 | #10 | Exceptional $119,496 |
| Okinawans | 100.0 /100 | #11 | Exceptional $119,349 |
| Immigrants | Iran | 100.0 /100 | #12 | Exceptional $119,204 |
| Immigrants | Eastern Asia | 100.0 /100 | #13 | Exceptional $118,056 |
| Immigrants | Israel | 100.0 /100 | #14 | Exceptional $117,219 |
| Immigrants | South Central Asia | 100.0 /100 | #15 | Exceptional $116,626 |
| Cypriots | 100.0 /100 | #16 | Exceptional $116,364 |
| Immigrants | Australia | 100.0 /100 | #17 | Exceptional $115,947 |
| Eastern Europeans | 100.0 /100 | #18 | Exceptional $114,523 |