Portuguese vs Immigrants from Serbia 11th Grade
COMPARE
Portuguese
Immigrants from Serbia
11th Grade
11th Grade Comparison
Portuguese
Immigrants from Serbia
92.0%
11TH GRADE
10.0/ 100
METRIC RATING
219th/ 347
METRIC RANK
93.5%
11TH GRADE
98.6/ 100
METRIC RATING
105th/ 347
METRIC RANK
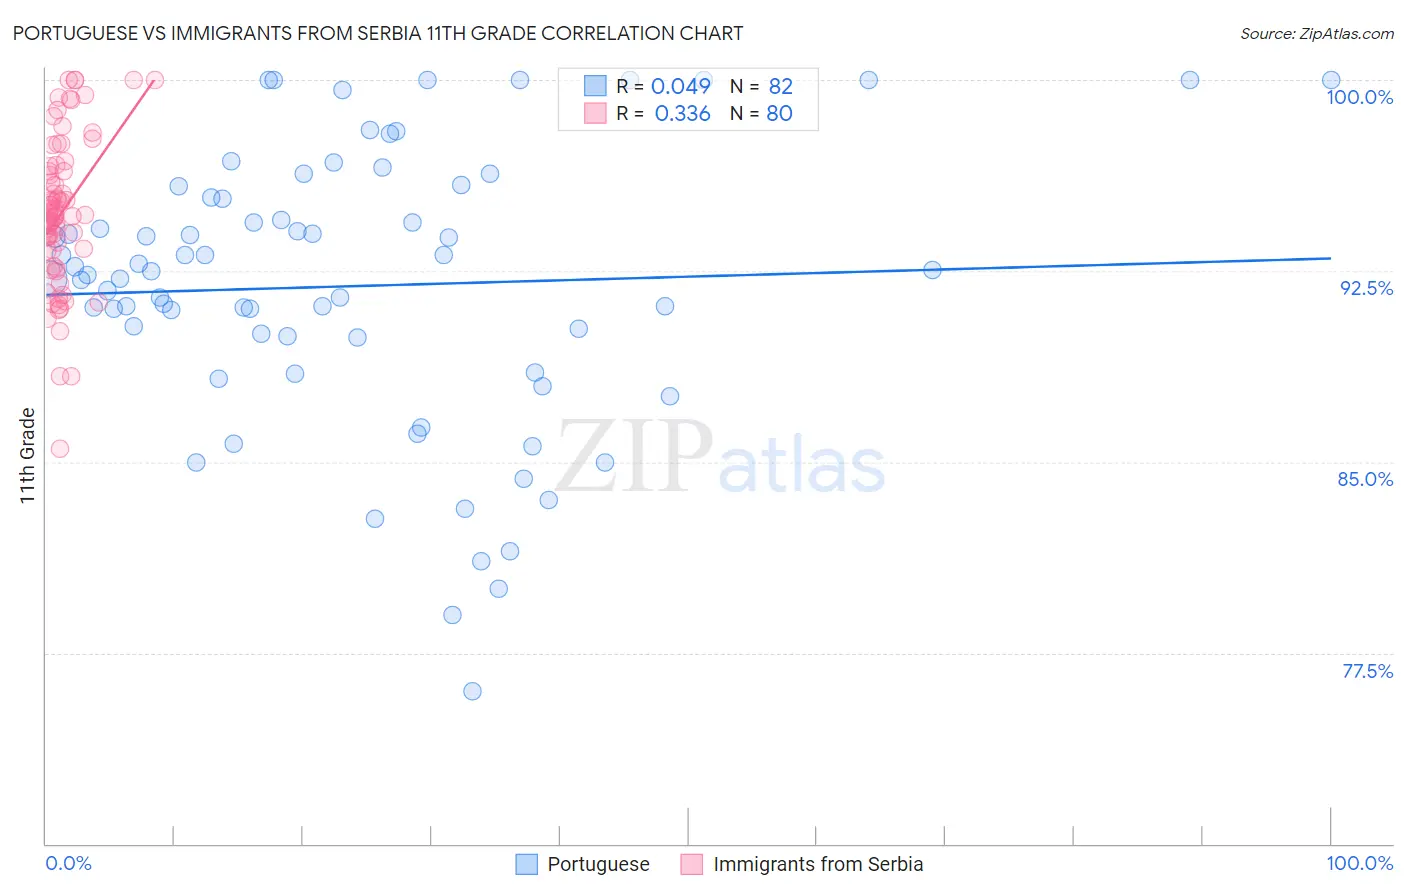
Portuguese vs Immigrants from Serbia 11th Grade Correlation Chart
The statistical analysis conducted on geographies consisting of 450,351,764 people shows no correlation between the proportion of Portuguese and percentage of population with at least 11th grade education in the United States with a correlation coefficient (R) of 0.049 and weighted average of 92.0%. Similarly, the statistical analysis conducted on geographies consisting of 131,745,658 people shows a mild positive correlation between the proportion of Immigrants from Serbia and percentage of population with at least 11th grade education in the United States with a correlation coefficient (R) of 0.336 and weighted average of 93.5%, a difference of 1.6%.
11th Grade Correlation Summary
| Measurement | Portuguese | Immigrants from Serbia |
| Minimum | 76.0% | 85.5% |
| Maximum | 100.0% | 100.0% |
| Range | 24.0% | 14.5% |
| Mean | 91.9% | 94.8% |
| Median | 92.4% | 94.7% |
| Interquartile 25% (IQ1) | 89.9% | 93.3% |
| Interquartile 75% (IQ3) | 95.4% | 96.5% |
| Interquartile Range (IQR) | 5.5% | 3.2% |
| Standard Deviation (Sample) | 5.4% | 2.9% |
| Standard Deviation (Population) | 5.4% | 2.9% |
Similar Demographics by 11th Grade
Demographics Similar to Portuguese by 11th Grade
In terms of 11th grade, the demographic groups most similar to Portuguese are Blackfeet (92.0%, a difference of 0.0%), Immigrants from Sierra Leone (92.0%, a difference of 0.030%), Somali (92.1%, a difference of 0.040%), Immigrants from Southern Europe (92.1%, a difference of 0.060%), and Afghan (92.1%, a difference of 0.070%).
| Demographics | Rating | Rank | 11th Grade |
| Koreans | 14.4 /100 | #212 | Poor 92.1% |
| Immigrants | Ethiopia | 13.9 /100 | #213 | Poor 92.1% |
| Afghans | 12.8 /100 | #214 | Poor 92.1% |
| Immigrants | Southern Europe | 12.5 /100 | #215 | Poor 92.1% |
| Somalis | 11.6 /100 | #216 | Poor 92.1% |
| Immigrants | Sierra Leone | 11.1 /100 | #217 | Poor 92.0% |
| Blackfeet | 10.1 /100 | #218 | Poor 92.0% |
| Portuguese | 10.0 /100 | #219 | Tragic 92.0% |
| South American Indians | 7.6 /100 | #220 | Tragic 92.0% |
| Immigrants | Liberia | 7.0 /100 | #221 | Tragic 91.9% |
| Immigrants | Africa | 6.5 /100 | #222 | Tragic 91.9% |
| Immigrants | Bahamas | 6.5 /100 | #223 | Tragic 91.9% |
| Costa Ricans | 6.3 /100 | #224 | Tragic 91.9% |
| Immigrants | Zaire | 5.4 /100 | #225 | Tragic 91.9% |
| Immigrants | Somalia | 5.2 /100 | #226 | Tragic 91.9% |
Demographics Similar to Immigrants from Serbia by 11th Grade
In terms of 11th grade, the demographic groups most similar to Immigrants from Serbia are Chippewa (93.5%, a difference of 0.0%), Lebanese (93.5%, a difference of 0.0%), Immigrants from Europe (93.5%, a difference of 0.0%), Immigrants from Croatia (93.5%, a difference of 0.0%), and Immigrants from Romania (93.5%, a difference of 0.010%).
| Demographics | Rating | Rank | 11th Grade |
| Immigrants | Israel | 98.8 /100 | #98 | Exceptional 93.5% |
| Menominee | 98.7 /100 | #99 | Exceptional 93.5% |
| Immigrants | North Macedonia | 98.7 /100 | #100 | Exceptional 93.5% |
| Immigrants | Romania | 98.7 /100 | #101 | Exceptional 93.5% |
| Chippewa | 98.6 /100 | #102 | Exceptional 93.5% |
| Lebanese | 98.6 /100 | #103 | Exceptional 93.5% |
| Immigrants | Europe | 98.6 /100 | #104 | Exceptional 93.5% |
| Immigrants | Serbia | 98.6 /100 | #105 | Exceptional 93.5% |
| Immigrants | Croatia | 98.6 /100 | #106 | Exceptional 93.5% |
| Immigrants | Norway | 98.4 /100 | #107 | Exceptional 93.5% |
| Alaska Natives | 98.4 /100 | #108 | Exceptional 93.5% |
| Immigrants | Kuwait | 98.4 /100 | #109 | Exceptional 93.5% |
| Syrians | 98.4 /100 | #110 | Exceptional 93.4% |
| Yugoslavians | 98.1 /100 | #111 | Exceptional 93.4% |
| Immigrants | Germany | 98.0 /100 | #112 | Exceptional 93.4% |